


Crypto Today: Crypto Today: Weak technicals, risk-off sentiment drag Bitcoin, Ethereum and XRP lower
- Bitcoin tests $88,000 support as investors navigate weak sentiment amid macroeconomic pressure.
- Ethereum slides below $3,000 but stays above $2,900 support as ETFs post inflows totaling $28 million on Wednesday.
- Stable institutional interest fails to boost sentiment as XRP slips below $1.90.
Bitcoin (BTC), Ethereum (ETH) and Ripple (XRP) are trading under pressure at the time of writing on Thursday amid a confluence of weak market sentiment and deteriorating technical structures.
The King of Crypto, Bitcoin, is struggling to maintain the critical $88,000 support level, while Ethereum has slipped below the psychologically vital $3,000 mark, and XRP continues its decline beneath $1.90 despite stable institutional interest.
The broader cryptocurrency market weakness reflects ongoing macroeconomic headwinds after the Federal Reserve (Fed) left interest rates unchanged in the range of 3.50%-3.75% at the end of its monetary policy meeting on Wednesday.
Weakening investor sentiment and technical headwinds have prompted traders to activate defence tactics, as they closely monitor key support levels that could determine the near-term trajectory of BTC, ETH and XRP.
Institutional interest favours Ethereum and XRP over Bitcoin
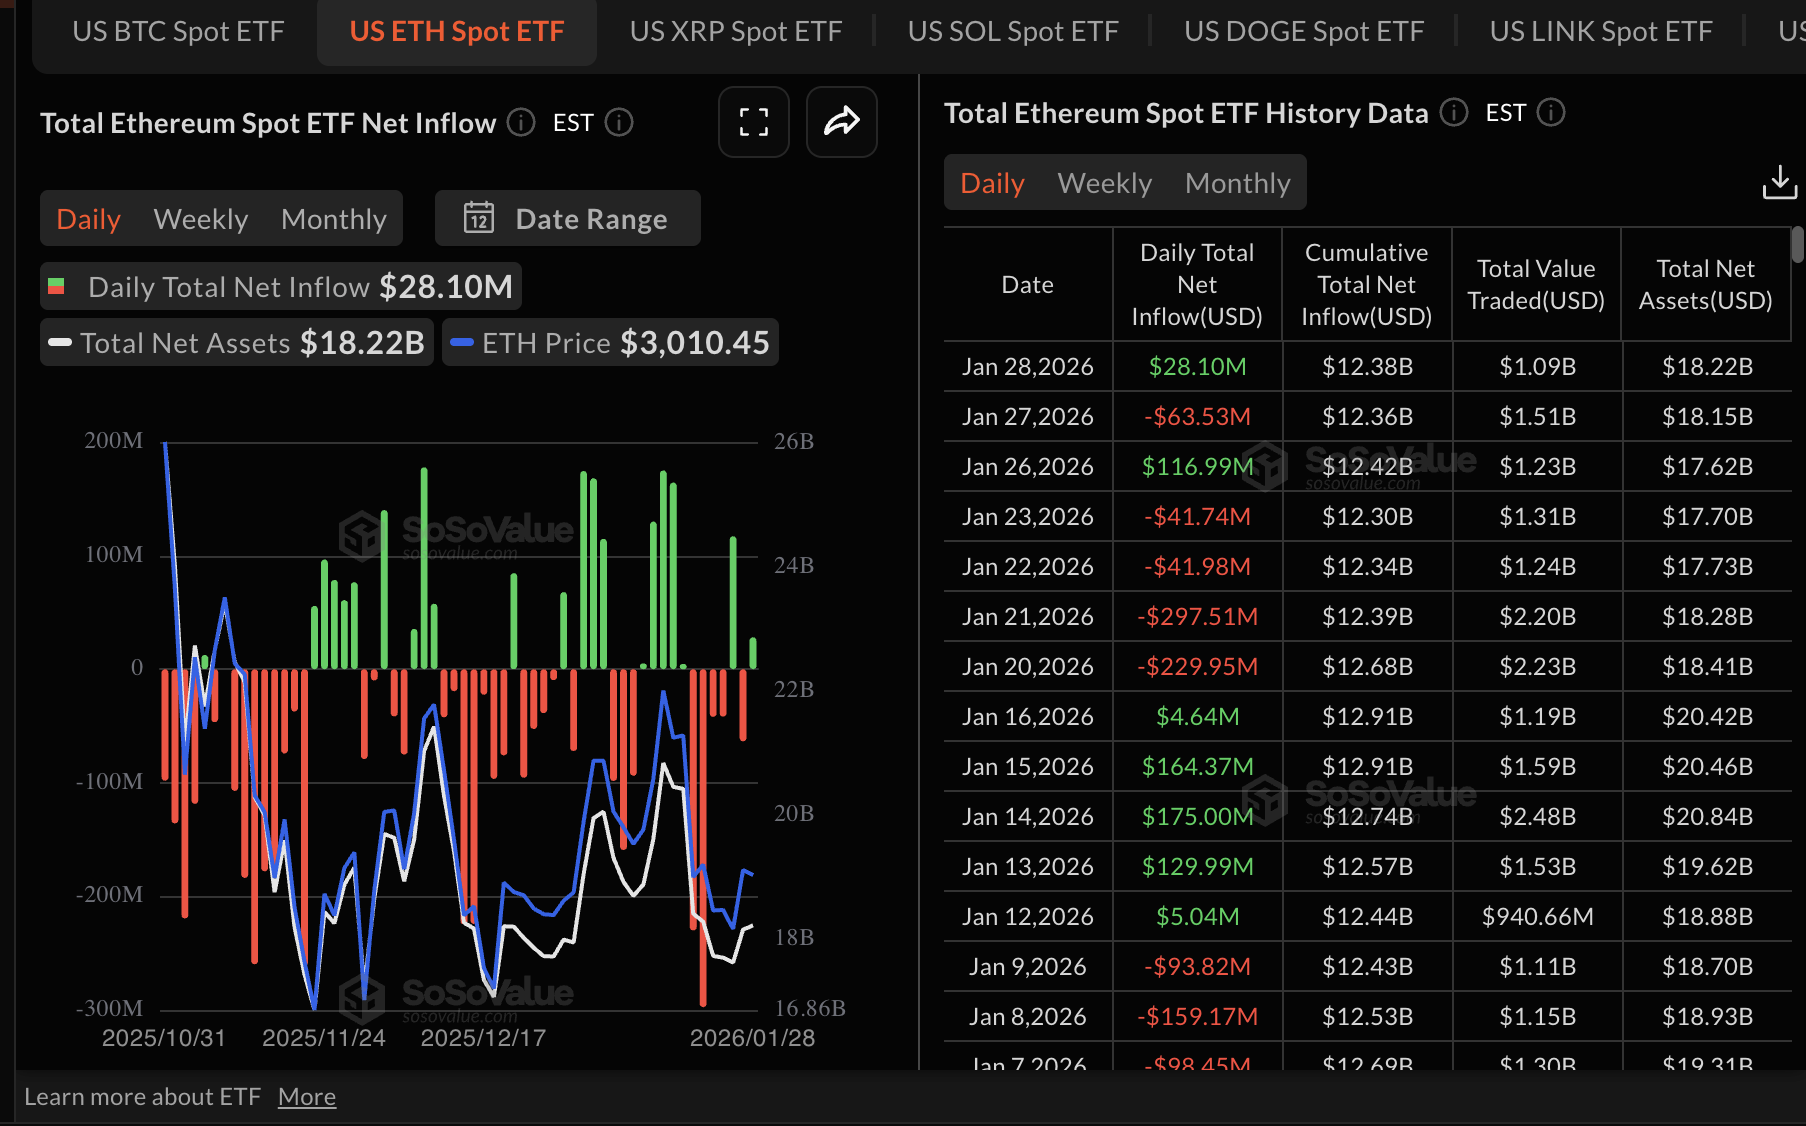
Ethereum Exchange-Traded Funds (ETFs) defied odds, posting approximately $28 million in inflows on Wednesday following recording nearly $64 million in outflows on Tuesday. BlackRock’s ETHA outpaced other ETFs, drawing $27 million in inflows, followed by Fidelity’s FETH with approximately $752,000. The cumulative total inflow stands at $12.38 billion, and net assets under management at $18.22 billion.
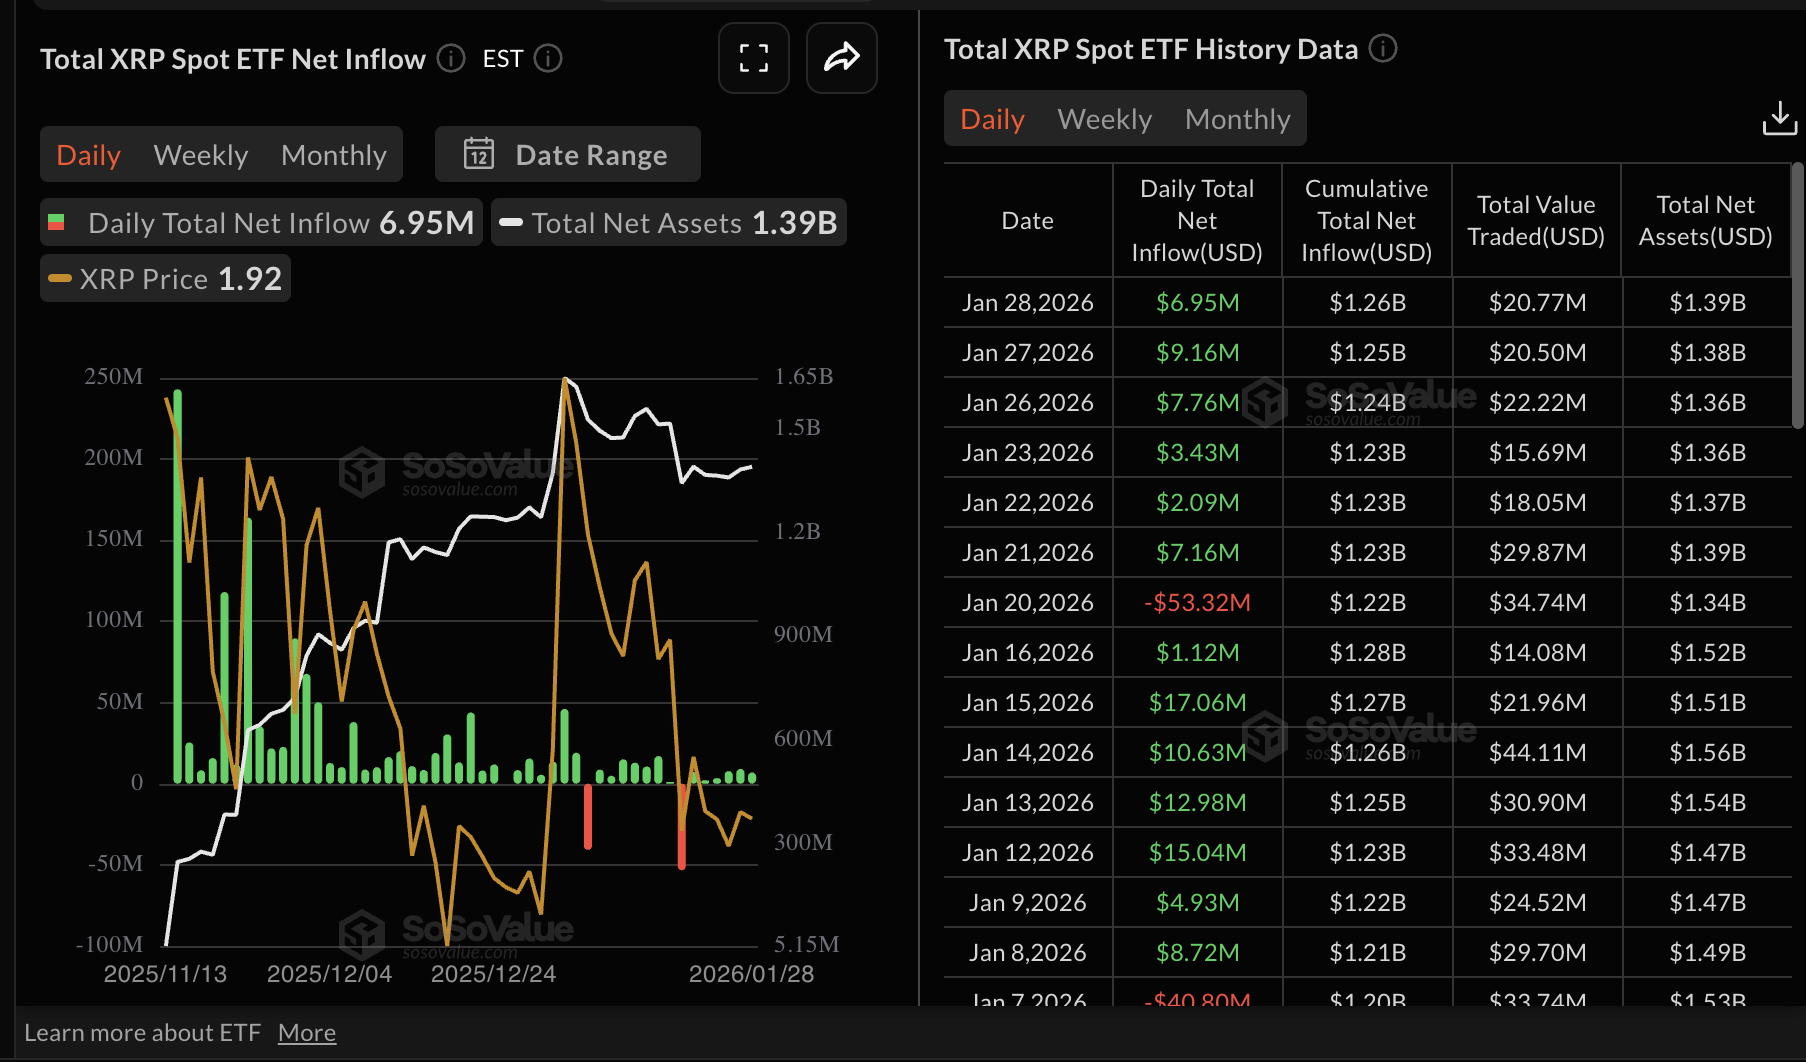
Interest in spot XRP ETFs has remained largely stable since their launch, despite price volatility. The five ETFs licensed to operate in the United States (US) recorded almost $7 million in inflows on Wednesday, bringing cumulative net inflows to $1.26 billion, while total assets under management hovered at $1.39 billion.
The unwavering institutional demand for XRP spot ETFs stands in stark contrast to broader crypto market weakness, as Bitcoin faced outflows of nearly $20 million on Wednesday. Bitcoin ETFs have experienced outflows totaling $160 million so far this week. Despite the outflows, BTC ETFs' cumulative inflows stand at $56.33 billion and net assets at $115.35 billion.
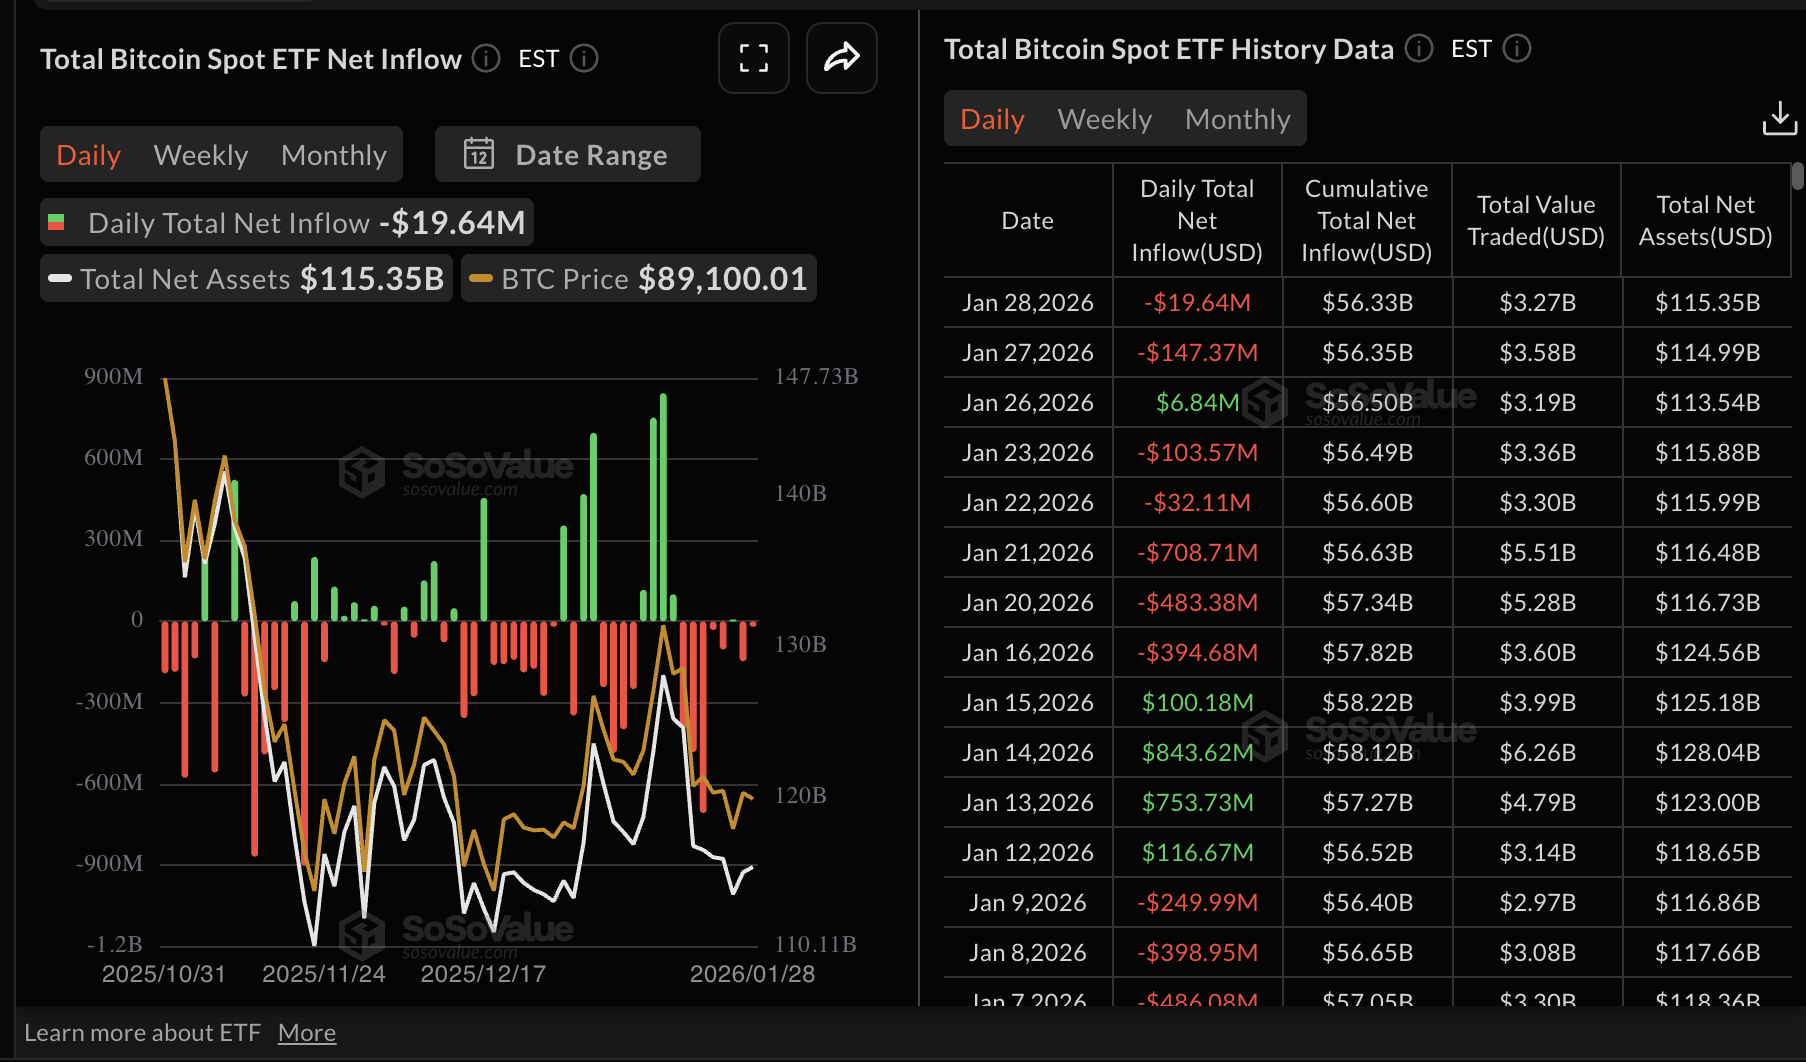
Chart of the day: Bitcoin extends decline as support holds
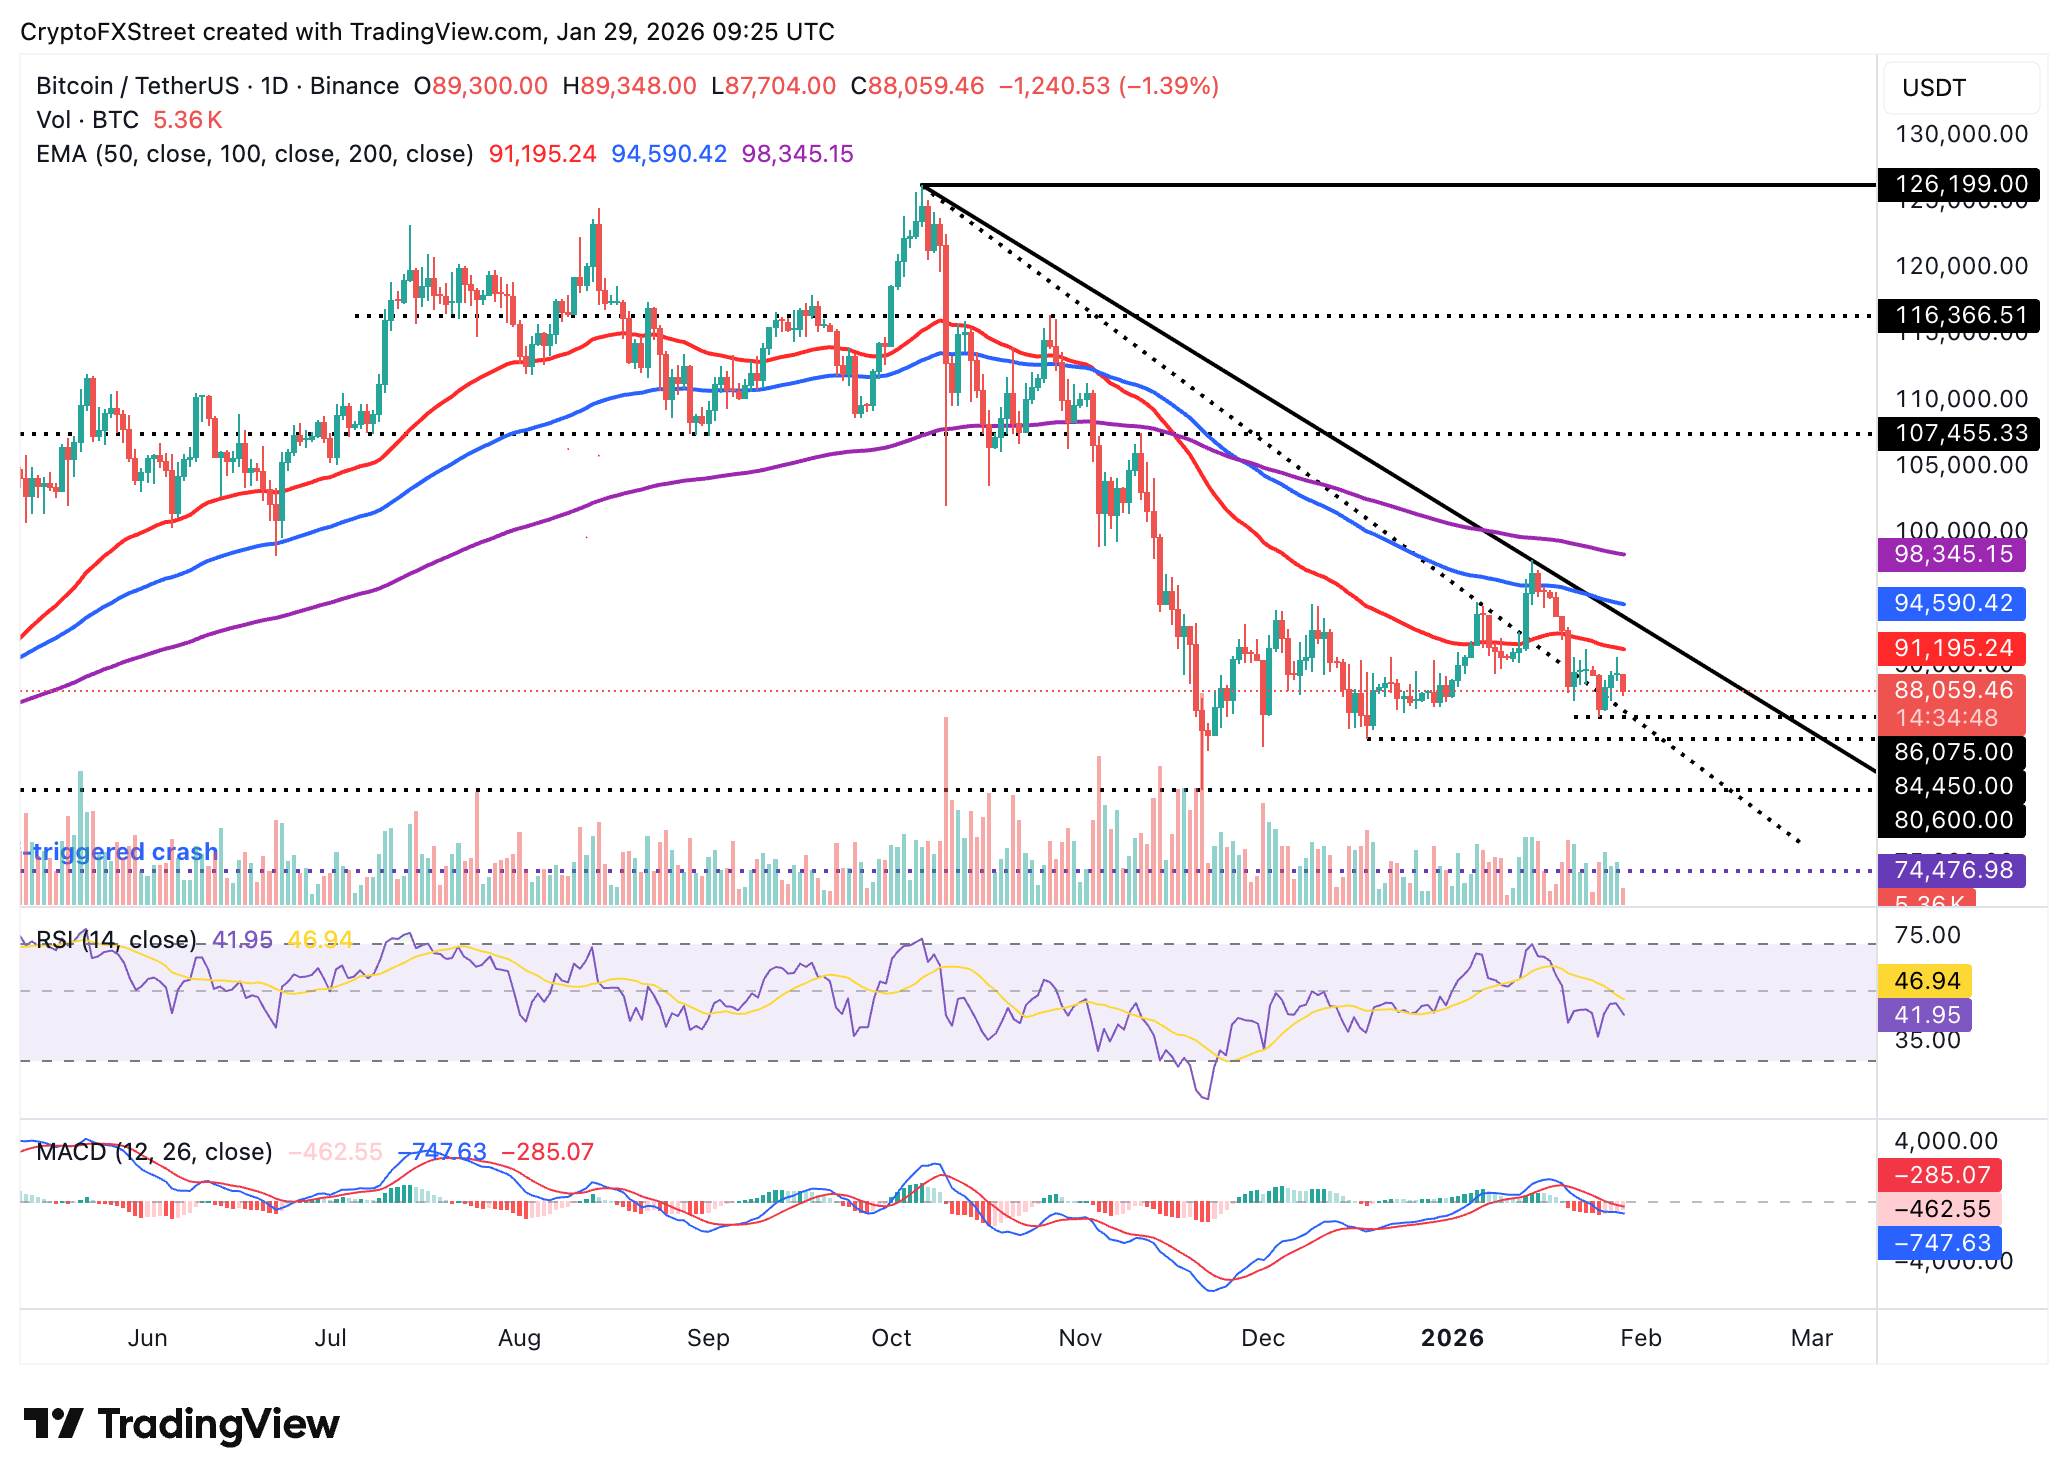
Bitcoin is trading at $88,059 at the time of writing, down roughly 1.39% intraday after opening near $89,300 and recording a low of $87,704.
The price sits below the 50-day Exponential Moving Average (EMA) at $91,195, the 100-day EMA at $94,590 and the 200-day EMA at $98,345, preserving the bearish outlook.
The Relative Strength Index (RSI) retreats to 42 on the daily chart, indicating that bearish momentum is expanding. Further decline in the RSI toward oversold territory could accelerate the downtrend to test the intraday low at $87,704.
The Moving Average Convergence Divergence (MACD) indicator remains below the signal line, suggesting that bearish momentum is intact, while histogram bars expanding below the zero line may prompt investors to reduce exposure.
A break above the 50-day EMA hurdle at $91,195 may reinstate the bulls and open the door for extended gains toward the next moving average cluster between $94,590 and $98,345.
Altcoins technical outlook: Ethereum, XRP slide as headwinds intensify
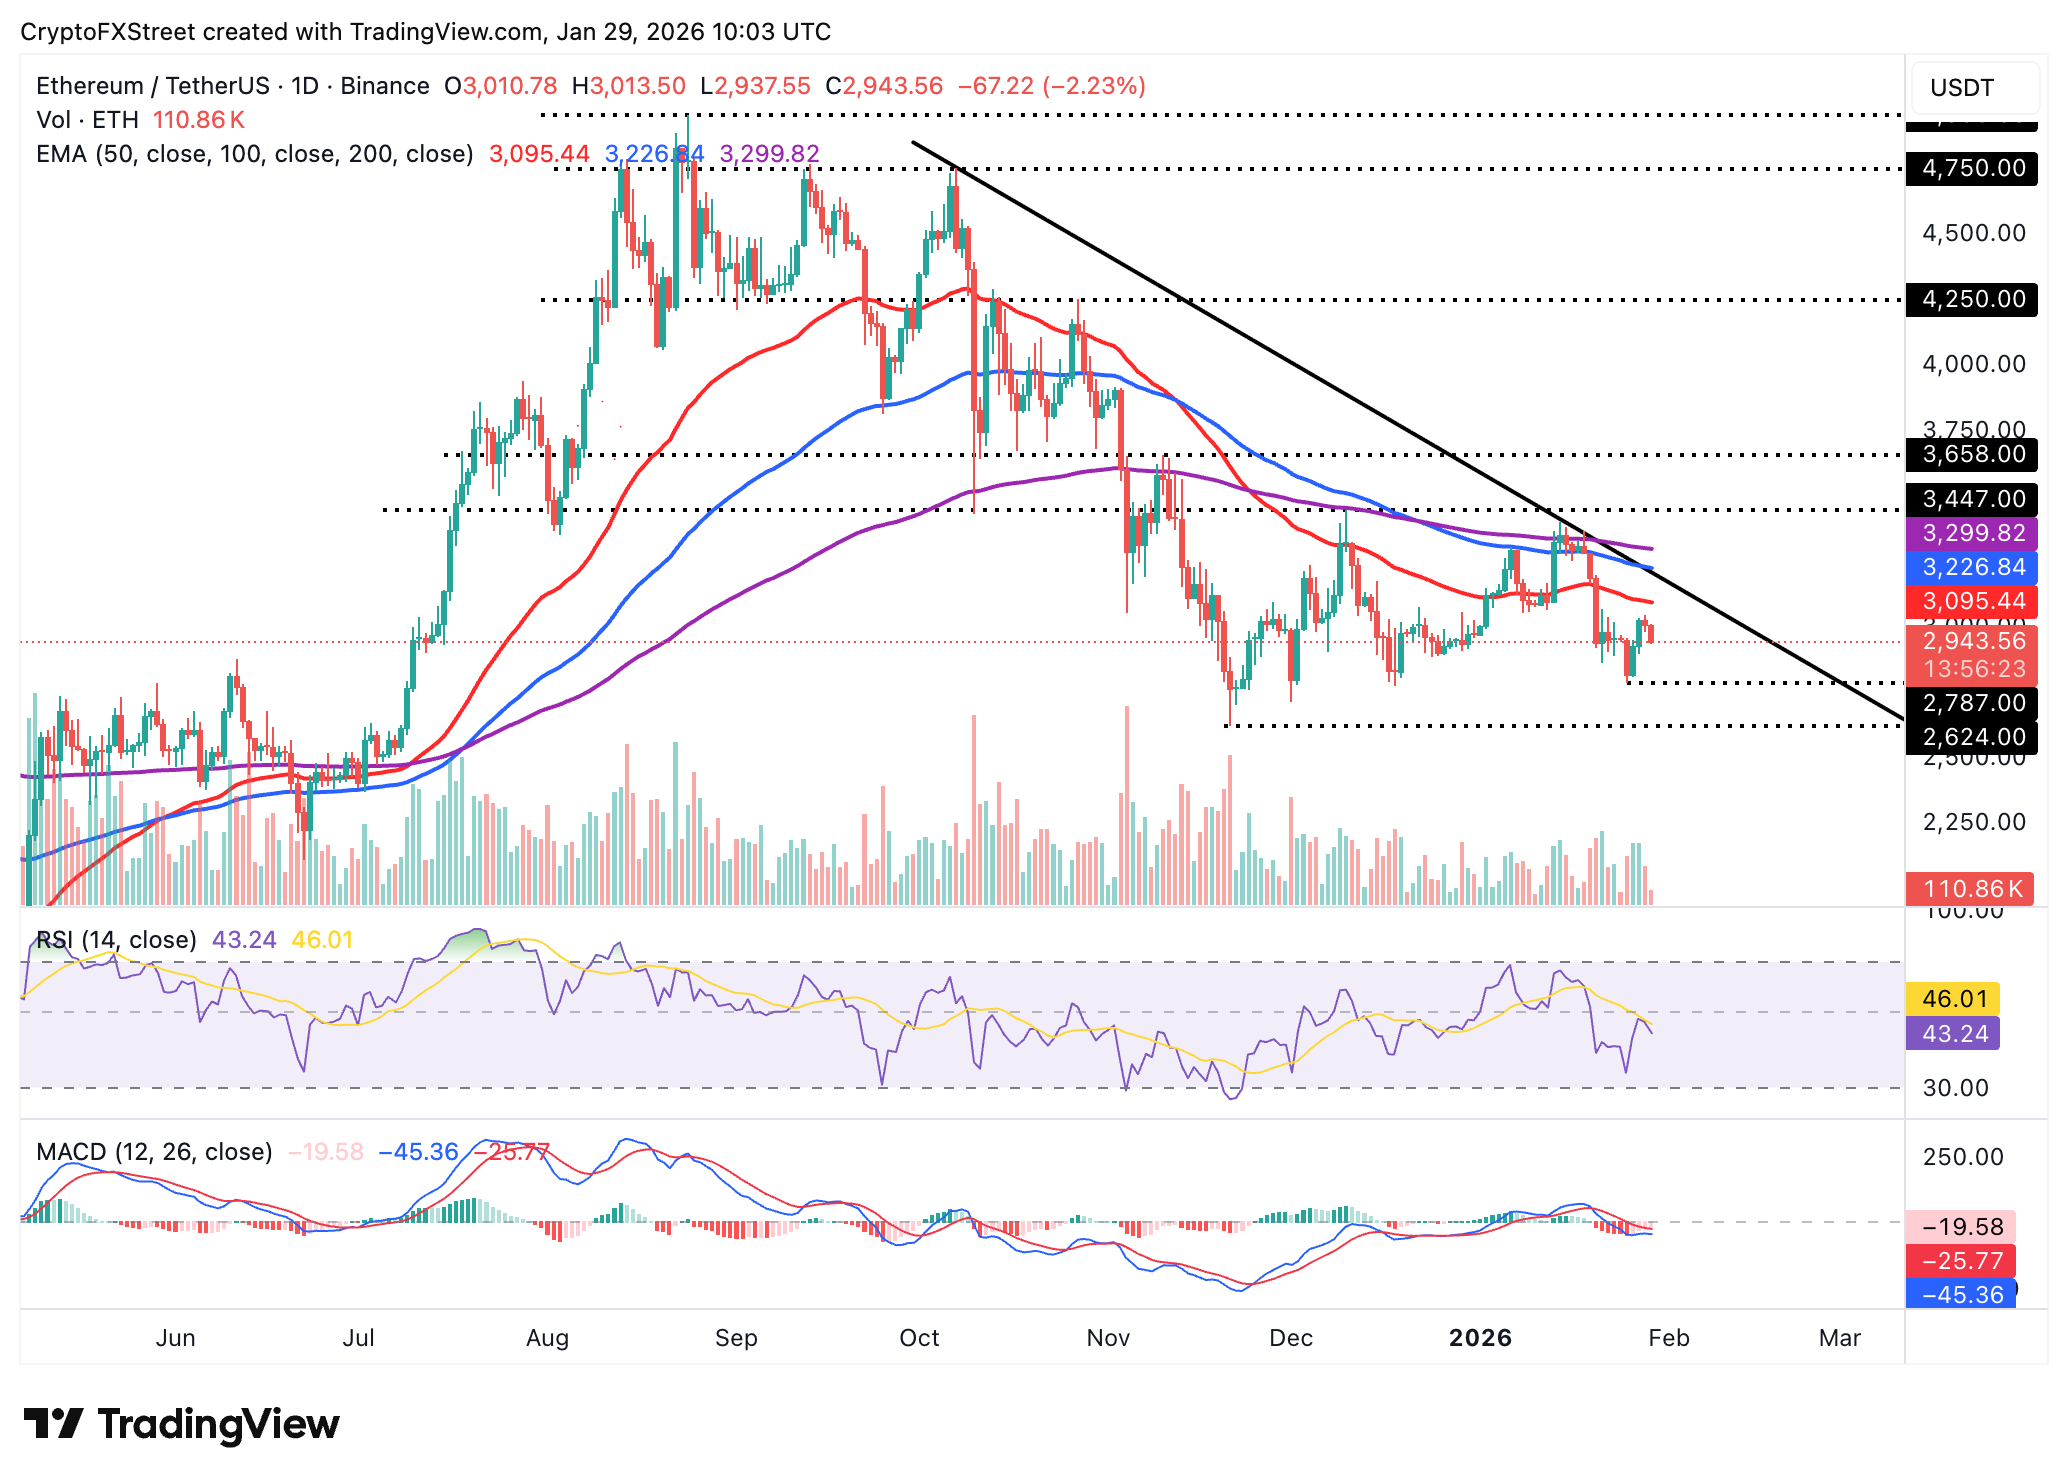
Ethereum is hovering between support at $2,900 and the pivotal psychological level at $3,000, down over 2% after opening at $3,011.
The RSI is grinding downward at 43 on the daily chart, holding the bearish bias intact. Meanwhile, the MACD is below its signal line on the same chart, and the histogram bars are expanding below the zero line. This confirms that bears remain in control and that the risk of Ethereum falling below its immediate support at $2,900 is increasing.
Any short-term bounce should reclaim the 50-day EMA at $3,095 to neutralize near-term pressure. A close above the next moving average cluster at $3,227 (100-day EMA) and $3,300 (200-day EMA) would require significant buying to challenge the broader downtrend and invalidate the bearish structure.
Meanwhile, sellers remain largely in control of XRP, with the token below the $1.90 key level and sliding toward Sunday’s low at $1.81. The downward-trending 50-day EMA at $2.01, the 100-day EMA at $2.14 and the 200-day EMA at $2.28 uphold the bearish outlook.
The RSI at 41 on the daily chart points to oversold territory, as bearish momentum builds. Also, the MACD leans bearishly below the signal line on the same chart, which may encourage investors to sell ETH as headwinds intensify.
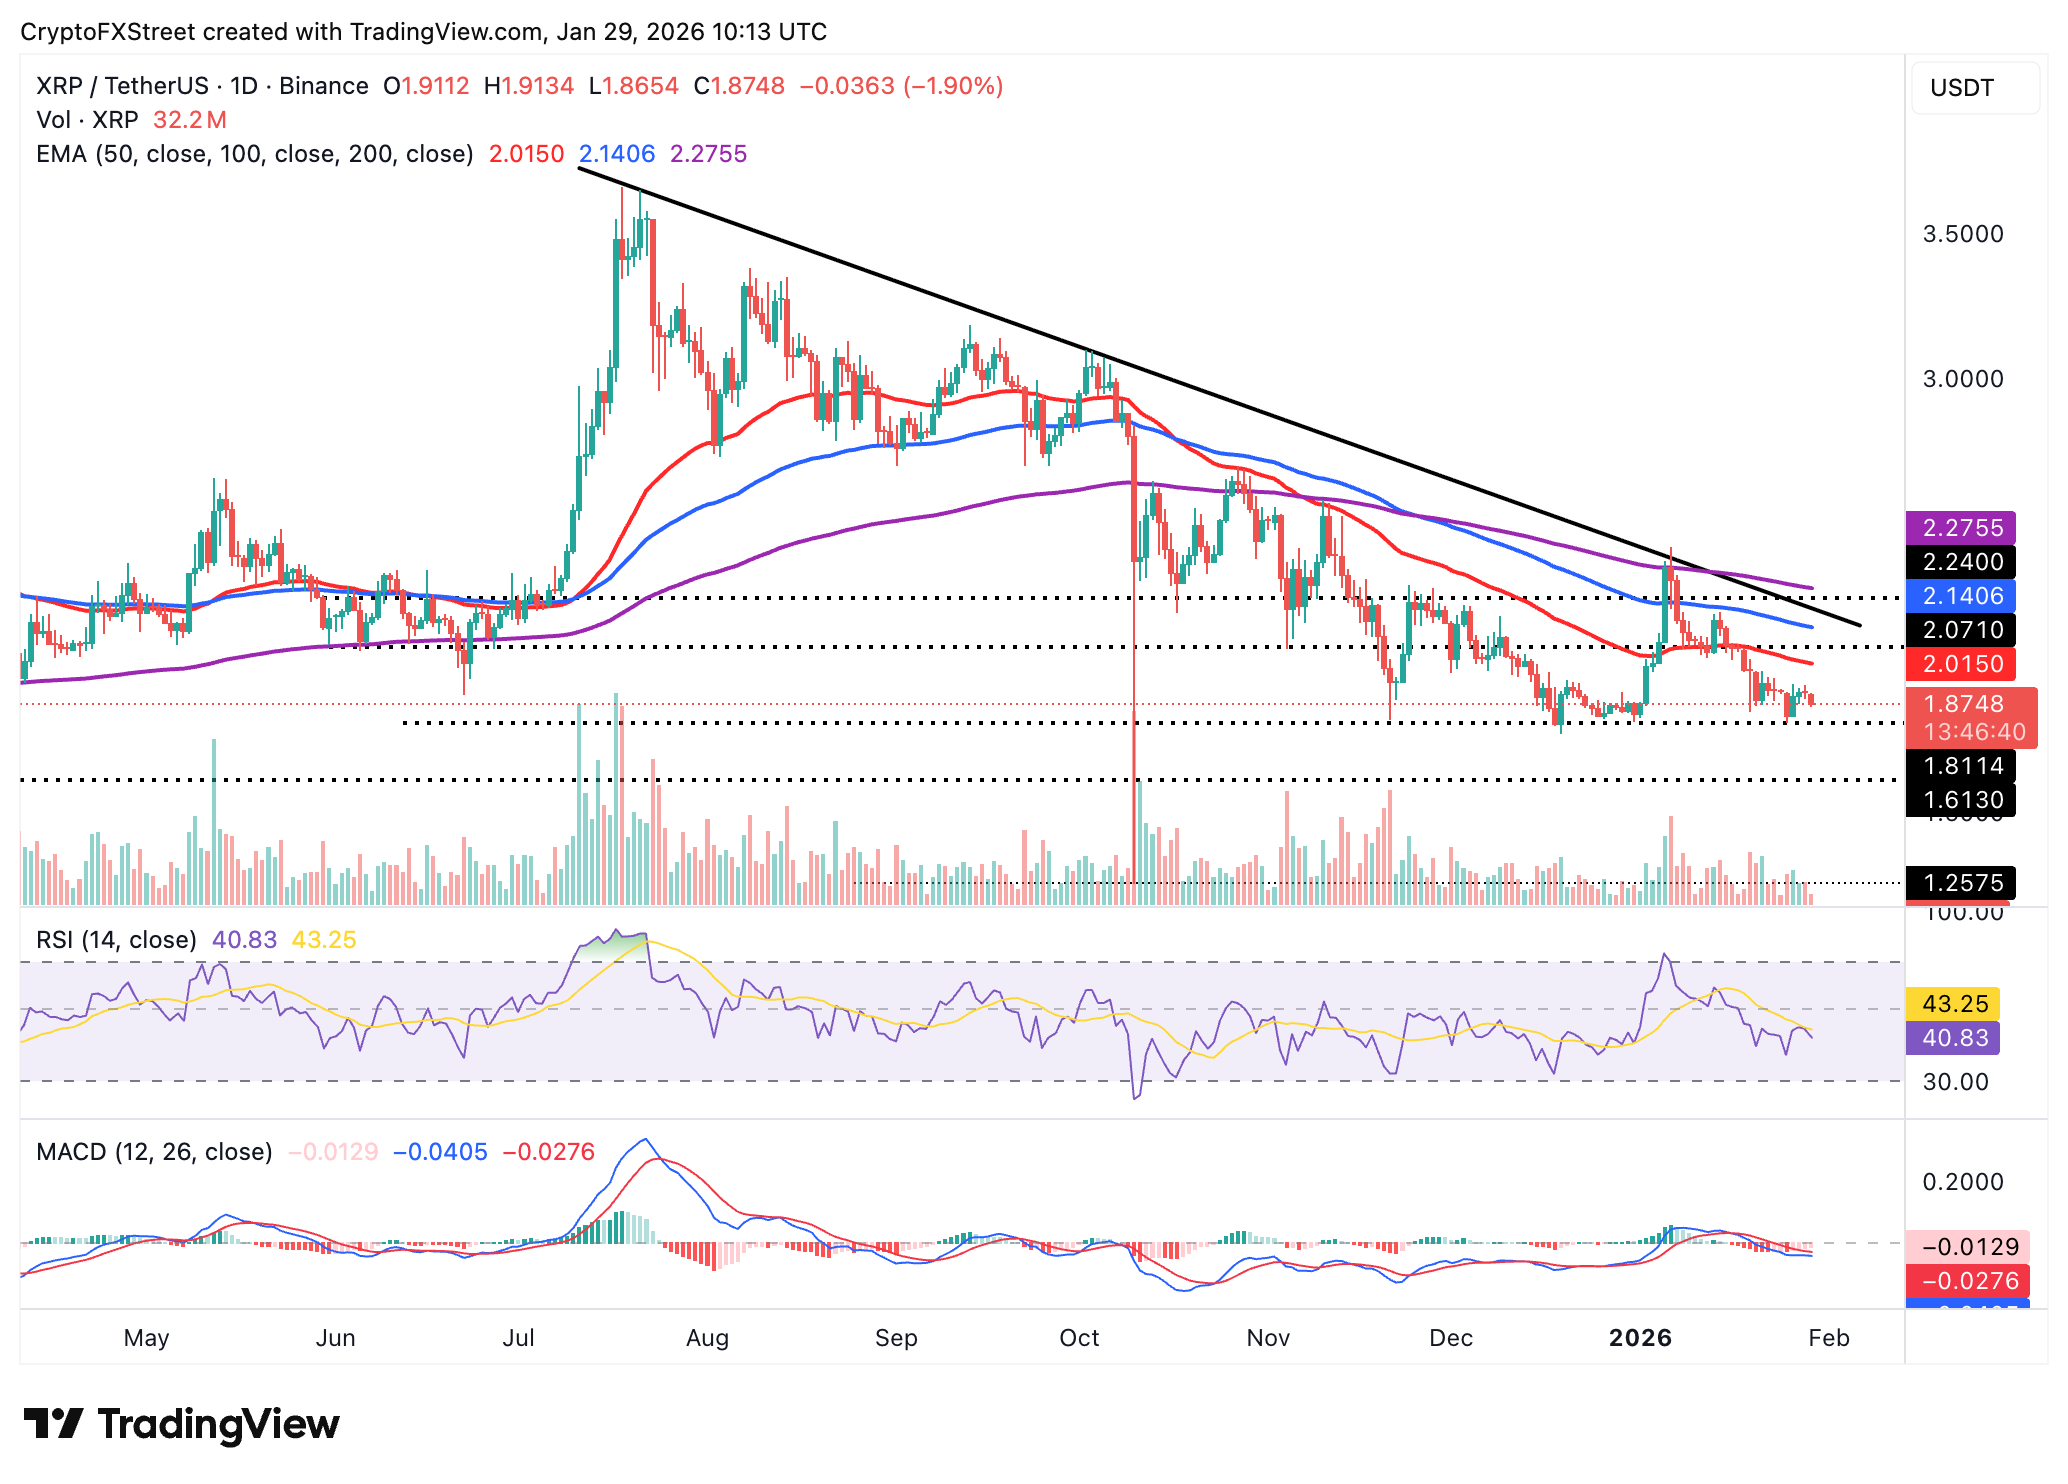
Overall, the technical picture points to continued downside pressure in the short-term unless buyers reclaim $1.90 as immediate support and push above the 50-day EMA at $2.01.
Cryptocurrency prices FAQs
Token launches influence demand and adoption among market participants. Listings on crypto exchanges deepen the liquidity for an asset and add new participants to an asset’s network. This is typically bullish for a digital asset.
A hack is an event in which an attacker captures a large volume of the asset from a DeFi bridge or hot wallet of an exchange or any other crypto platform via exploits, bugs or other methods. The exploiter then transfers these tokens out of the exchange platforms to ultimately sell or swap the assets for other cryptocurrencies or stablecoins. Such events often involve an en masse panic triggering a sell-off in the affected assets.
Macroeconomic events like the US Federal Reserve’s decision on interest rates influence crypto assets mainly through the direct impact they have on the US Dollar. An increase in interest rate typically negatively influences Bitcoin and altcoin prices, and vice versa. If the US Dollar index declines, risk assets and associated leverage for trading gets cheaper, in turn driving crypto prices higher.
Halvings are typically considered bullish events as they slash the block reward in half for miners, constricting the supply of the asset. At consistent demand if the supply reduces, the asset’s price climbs.
Recommended Articles


