

Ethereum price struggles to appreciate as Q1 report shows token burns outpace emissions
- Ethereum validator queue increase shows that restaking boom may be attracting more investors.
- Ethereum shows deflationary signs as its burn rate outpaces emissions.
- Ethereum may continue trading sideways as bears seem to be running out of steam.
Ethereum (ETH) continued a sideways movement on Wednesday as investors seemed to be waiting for an upward or downward price catalyst. Despite the price stagnancy, the ETH validator queue - possibly fueled by the DeFi restaking boom - rose sharply.
Read more: Ethereum declines as crypto market crash increases bearish sentiment
Daily digest market movers: validator queue, restaking boom, token burns, whale deposits
Ethereum's price is yet to show signs of appreciation on Wednesday as the market is moving slowly. Here are key market movers for the number one altcoin:
- Ethereum's validator queue saw a sharp increase in April, growing more than 150% in the past month to reach 21,551 - its highest level since September 2023 - according to data from Validator Queue. Active validators within the network are also approaching the one million mark, growing from around 902,884 validators on January 1 to 984,375 on April 17.
- The surge in validator interest can be attributed to the popularity of maximizing yields through Ethereum restaking. Made possible by Eigenlayer, users can earn additional rewards by using their staked ETH tokens to provide security to other protocols like bridges, oracles or rollups. In Q1, total restaked ETH grew by 36%, with over 4.3 million tokens restaked on Eigenlayer, according to CoinGecko. Liquid restaking protocols accounted for 2.28 million restaked ETH.
- ETH burn rate is outpacing its emissions as more than 113,000 ETH were taken out of circulation in Q1, according to CoinGecko. The total number of ETH burned in Q1 was about 333,600 ETH compared to an emission of 270,500 ETH. This indicates that token burns are gradually making ETH deflationary despite not having a supply cap.
Also read: Ethereum recovers from dip as Hong Kong ETH ETF approval sparks whale buying spree
- CoinGecko also highlighted the increase in Ethereum Layer 2 adoption in its crypto industry Q1 report. L2s saw more than 900 million transactions in Q1 after the Ethereum Improvement Proposal EIP-4844 implementation in the Dencun upgrade saw gas fees reduced.
- While some whales bought the bottom by moving ETH over exchanges in the past week, FUD surrounding the second largest digital asset has been increasing recently following the market dump, according to Santiment. Celsius network deposited 8,091 ETH worth $24.5 million to Coinbase on Wednesday - their largest ETY deposit in three months - according to Spot On Chain. Between November and January, Celsius moved 847,626 worth an average of $1.9 billion to several centralized exchanges.
Another whale who bought 96,638 ETH from Coinbase at $1,567 in September seemed to be taking profit as he deposited 5,000 ETH to Kraken on Tuesday, according to Lookonchain.
Technical analysis: ETH to maintain sideways movement
Ethereum has struggled to enter an upward trajectory on Wednesday as it still hovers around the $3,000 support. It has continued a sideways downward-like movement as there's no catalyst to cause a significant price shift yet.
While ETH continues filling the liquidity void formed on Saturday, a short-term Bitcoin halving effect could cause it to move upward briefly to cover the previous liquidity void of April 12. However, ETH faces a key resistance of $3,406 formed on April 7.
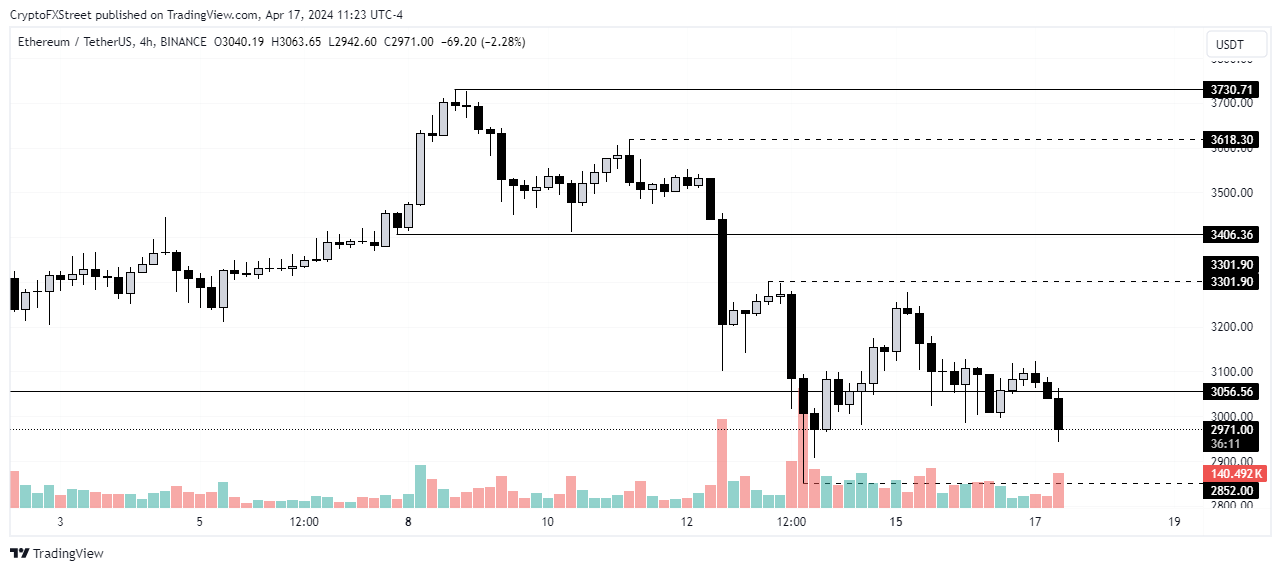
ETH/USDT 1-hour chart
As stated previously, ETH may continue trading within the range of $2,852 and $3,301 in the next few days, except if major factors prevail. These factors include the Iran-Israel conflict, Bitcoin dominance, and the Securities & Exchange Commission's (SEC) decision on an ETH approval.
Read more: Ethereum price stagnates as EIP-3074 brings smart contract functionalities to wallets
Another factor to note is that ETH long liquidations have slowed down compared to the past two days. Long liquidations in the past 24 hours are at $29.3 million. This indicates that bear traders may be running out of steam; hence, a further price decline below the range given above isn't expected.
ETH is trading at $2,989 at the time of writing.
Bitcoin, altcoins, stablecoins FAQs
Bitcoin is the largest cryptocurrency by market capitalization, a virtual currency designed to serve as money. This form of payment cannot be controlled by any one person, group, or entity, which eliminates the need for third-party participation during financial transactions.
Altcoins are any cryptocurrency apart from Bitcoin, but some also regard Ethereum as a non-altcoin because it is from these two cryptocurrencies that forking happens. If this is true, then Litecoin is the first altcoin, forked from the Bitcoin protocol and, therefore, an “improved” version of it.
Stablecoins are cryptocurrencies designed to have a stable price, with their value backed by a reserve of the asset it represents. To achieve this, the value of any one stablecoin is pegged to a commodity or financial instrument, such as the US Dollar (USD), with its supply regulated by an algorithm or demand. The main goal of stablecoins is to provide an on/off-ramp for investors willing to trade and invest in cryptocurrencies. Stablecoins also allow investors to store value since cryptocurrencies, in general, are subject to volatility.
Bitcoin dominance is the ratio of Bitcoin's market capitalization to the total market capitalization of all cryptocurrencies combined. It provides a clear picture of Bitcoin’s interest among investors. A high BTC dominance typically happens before and during a bull run, in which investors resort to investing in relatively stable and high market capitalization cryptocurrency like Bitcoin. A drop in BTC dominance usually means that investors are moving their capital and/or profits to altcoins in a quest for higher returns, which usually triggers an explosion of altcoin rallies.
Recommended Articles


