


Bitcoin Short-Term Holders Capitulate: 30K BTC In Realized Losses Over 24 Hours
Bitcoin is once again at a turning point as the market struggles to recover from heavy selling pressure. After losing the $115,000 level earlier this week, BTC is now fighting to hold $110,000, a threshold that many investors see as critical for maintaining short-term stability. The sharp drop has shaken confidence, with traders increasingly concerned about the possibility of a deeper correction if support fails.
Market sentiment has shifted quickly from bullish optimism to caution, as volatility rises and momentum fades. The broader crypto market has mirrored Bitcoin’s moves, with altcoins also suffering significant declines. This phase of consolidation and retracement has left investors uncertain, unsure whether the recent dip represents a temporary pullback or the beginning of a larger corrective phase.
Amid this turbulence, top analyst Darkfost highlighted a key onchain signal: it has been another painful day for short-term holders (STHs). Data shows that STHs realized losses of around 30,000 BTC in just one day. For many of the most recent buyers, unrealized profits have already evaporated, with some now selling at steep losses.
Bitcoin STH Face Losses, But Market Outlook Holds
Darkfost’s recent analysis highlights the mounting pressure on Bitcoin’s short-term holders (STHs). With BTC trading near $111,400, most of their unrealized profits have been nearly wiped out, leaving the newest market entrants facing realized losses. Data shows that STHs collectively absorbed an estimated 30,000 BTC in losses in a single day, underscoring the severity of the recent correction. For traders, this has been painful, but Darkfost argues it is actually constructive for the short-term outlook.

He explains that when STHs capitulate, it often acts as a cleansing event for the market. Excessive leverage is flushed out, weak hands exit their positions, and the supply overhang diminishes. While “annoying in the very, very short term,” as Darkfost puts it, such resets typically create stronger foundations for the next move higher. This pattern has been observed in previous cycles, where brief periods of realized losses paved the way for sustained rallies once selling pressure subsided.
At the macro level, conditions remain challenging as global markets digest tighter liquidity and slower economic growth. Still, many analysts believe Bitcoin is well-positioned in the long run, particularly as institutional adoption and regulatory clarity progress. In their view, current volatility may simply be part of the transition toward a healthier and more resilient market structure.
Price Analysis: Testing Support After BreakdownBitcoin’s price action shows clear weakness after losing the $115K level, with the chart now testing support near $113K. The breakdown comes as the bullish momentum that fueled previous rallies fades, leaving BTC vulnerable to volatility. Currently, price trades below the 50-day moving average, signaling pressure in the short term. The 100-day SMA around $113,337 is now acting as a key support level, and its defense will be crucial to avoid a deeper correction.
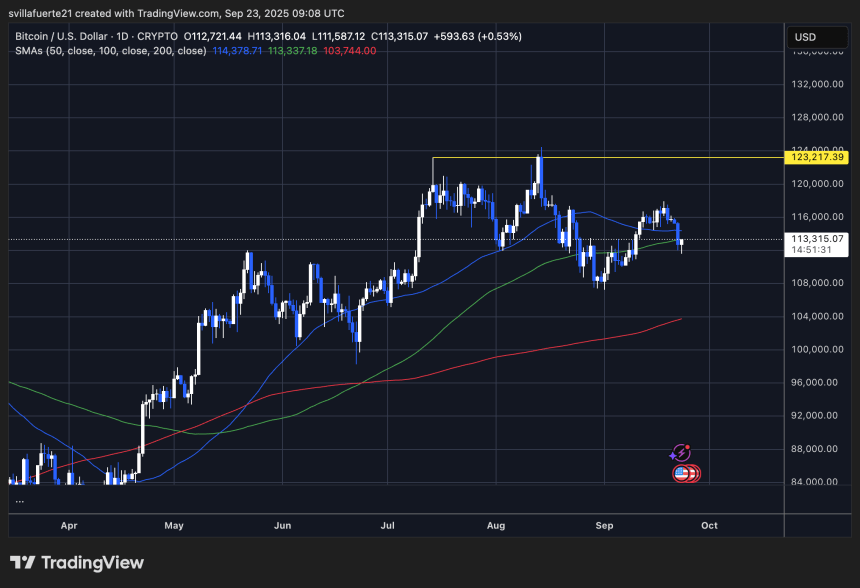
The recent drop highlights a rejection near the $123K resistance zone, where the market failed to build sustained momentum. If Bitcoin manages to hold above the $113K area, consolidation could follow before another attempt at recovery. However, a decisive move below this level risks exposing BTC to the $110K psychological level, where buyers are likely to step in.
Momentum indicators suggest the market remains in a corrective phase rather than a full reversal, with higher lows still intact from June levels. As long as BTC avoids a breakdown below $110K, the broader bullish structure remains valid. Traders will closely watch whether Bitcoin can stabilize above its current support or whether further selling pressure from long-term holders and broader market uncertainty drags it lower.
Featured image from Dall-E, chart from TradingView
Recommended Articles


