

Meme Coins Price Prediction: Dogecoin, Shiba Inu, and Pepe extend corrections as market sentiment turns cautious

Source Fxstreet
  • Dogecoin price resumes its pullback on Monday after sliding 6% in the previous week.
  • Shiba Inu price closes below the 50-day EMA, raising the risk of a deeper correction.
  • Pepe price trades lower, with momentum indicators flashing bearish signals.

Meme coins face renewed selling pressure at the start of this week on Monday, with Dogecoin (DOGE), Shiba Inu (SHIB), and Pepe (PEPE) extending their losses after recent corrections. The technical outlook of these meme coins signals a bearish momentum, suggesting further losses in the upcoming days.

Dogecoin Price Forecast: DOGE extends losses

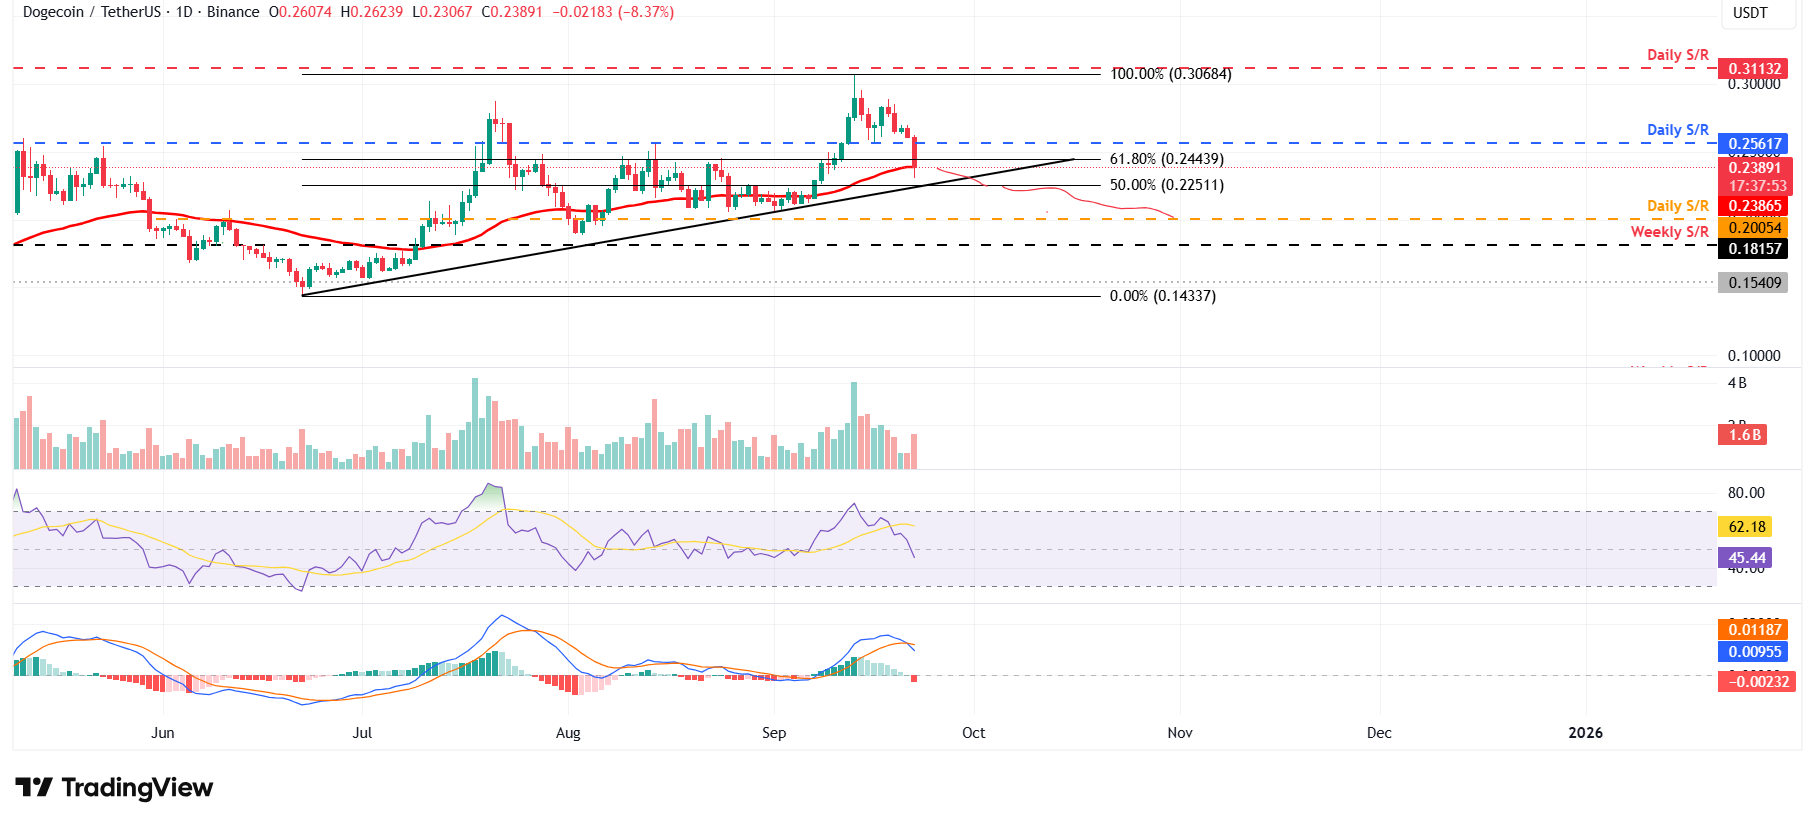
Dogecoin price faced a correction around its daily resistance level of $0.311 on September 13 and declined by 8% over the next two days, finding support at the daily support level of $0.256. DOGE recovered slightly but failed to maintain its gains, declining 6.20% in the previous week. At the start of this week, on Monday, it is extending its correction by 8% so far, trading below $0.239 at the time of writing.

If DOGE continues to correct and closes below its 50-day Exponential Moving Average (EMA) at $0.238, it could extend the correction toward its next daily support at $0.200.

The Relative Strength Index (RSI) on the daily chart reads 45, below its neutral level of 50, indicating bearish momentum. Additionally, the Moving Average Convergence Divergence (MACD) on the same chart shows a bearish crossover on Monday, giving a sell signal and suggesting a potential downward trend ahead.
DOGE/USDT daily chart 

DOGE/USDT daily chart 

However, if DOGE finds support around the 50-day EMA at $0.238, it could extend the recovery toward the daily resistance level at $0.311.

Shiba Inu Price Forecast: SHIB bears are in control of momentum 

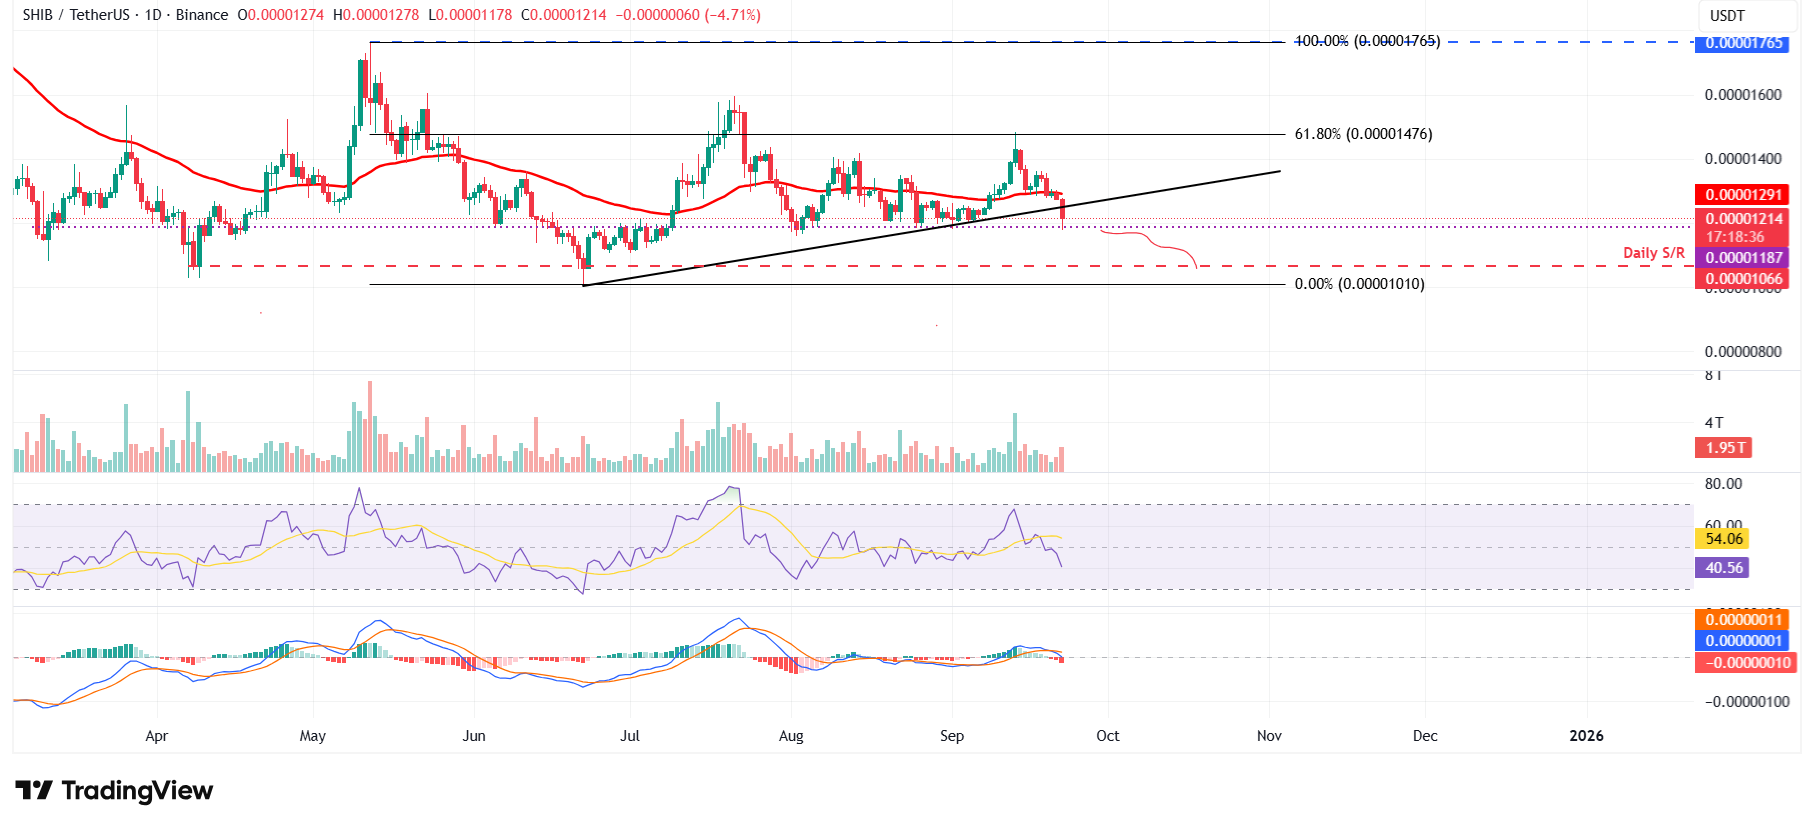
Shiba Inu price found rejection around its 61.8% Fibonacci retracement level at $0.0000147 (drawn from the May 12 high of $0.0000176 to the June 22 low of $0.0000100) on September 13 and declined by nearly 8% by Sunday. At the time of writing on Monday, it continues to trade down at around 0.0000121, breaking below the ascending trendline (drawn by connecting multiple lows since June 22).

If SHIB continues its correction and closes below the daily support at $0.0000118, it could extend the decline to the next daily support at $0.0000106.

The RSI on the daily chart reads 40, below its neutral level of 50, indicating strong bearish momentum. The MACD also showed a bearish crossover on Saturday, further supporting the bearish outlook.
SHIB/USDT daily chart

SHIB/USDT daily chart

On the other hand, if SHIB recovers, it could advance toward the 50-day EMA at $0.0000129.

Pepe Price Forecast: PEPE bears aiming for $0.0000079 mark

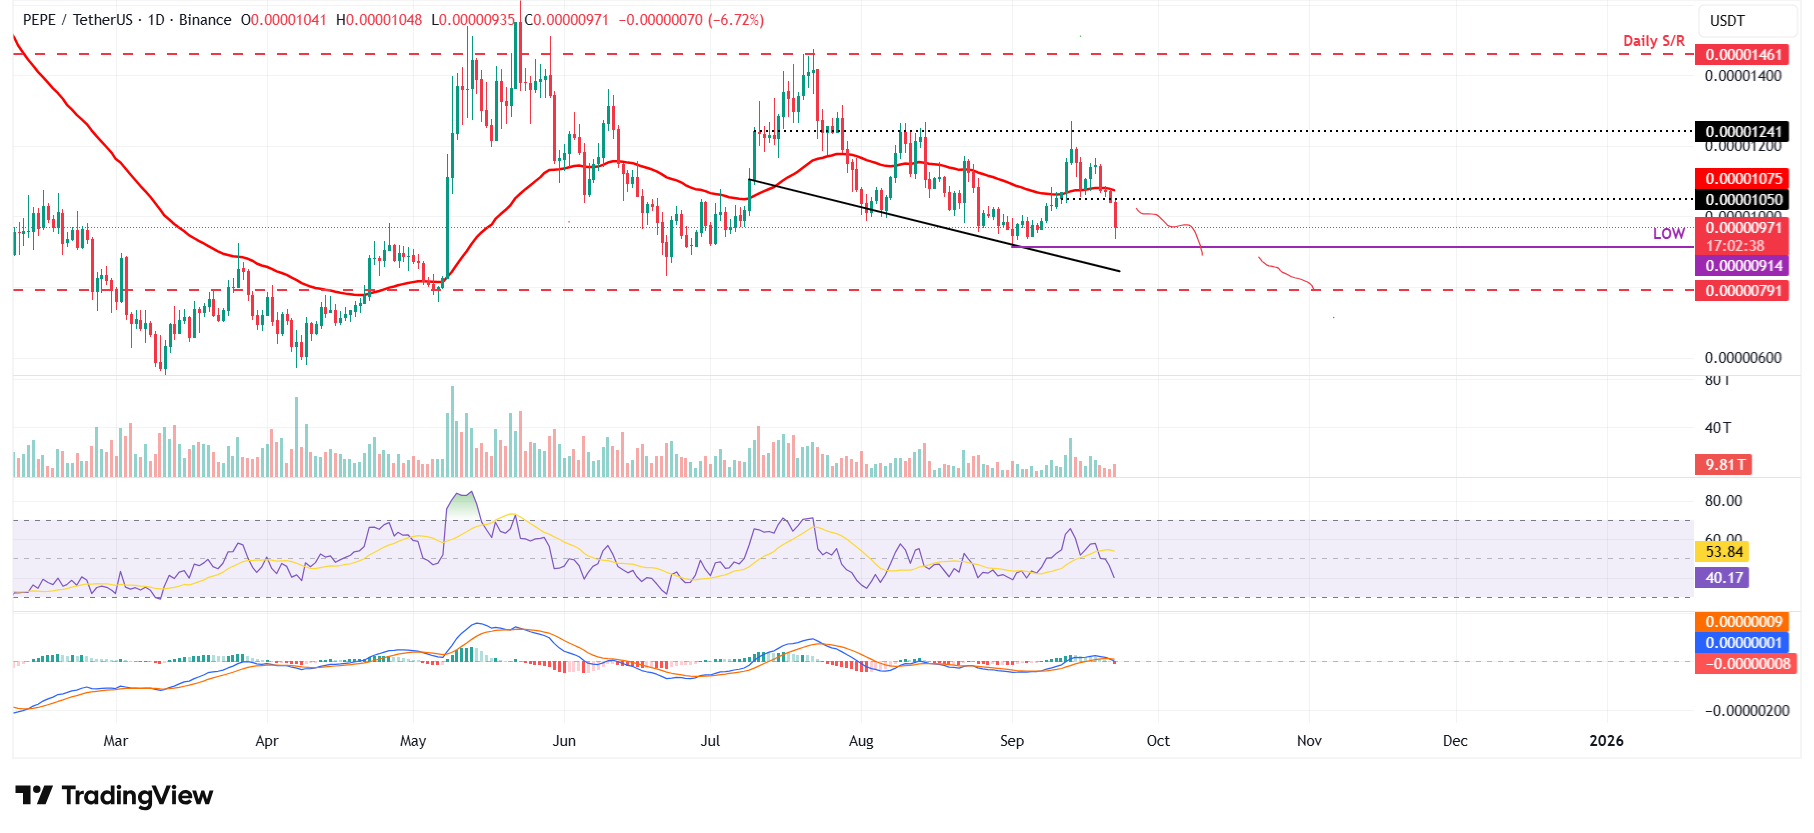
Pepe price closed below the 50-day EMA at $0.0000107 on Friday and declined 3.25% by Sunday. At the start of this week on Monday, it is losing by 6.72%, trading around $0.0000097.

If PEPE continues its downward trend, it could restest the daily support at $0.0000079.

Like DOGE and SHIB, PEPE’s RSI and MACD indicators signal weakening momentum, supporting the bearish view. 
PEPE/USDT daily chart 

PEPE/USDT daily chart 

However, if PEPE recovers, it could retest the 50-day EMA at $0.0000107.

Disclaimer: For information purposes only. Past performance is not indicative of future results.
placeholder
Gold Price Forecast: Gold Eyes Key $4,400 Resistance as Falling Oil Prices Ease Inflation PressureAs of the Asian session on September 21, gold prices (XAUUSD) maintained high-level consolidation intraday today following a strong rebound last week, with the latest price trading around
Author  TradingKey
9 hours ago
As of the Asian session on September 21, gold prices (XAUUSD) maintained high-level consolidation intraday today following a strong rebound last week, with the latest price trading around
placeholder
Crude Oil Price Forecast: Can Brent Hold $100 as Saudi Export Recovery Weighs on Risk Premium?International oil prices fell for a fourth consecutive trading day on Monday, marking their longest losing streak since June. Although Iranian-backed Houthi militants launched fresh attac
Author  TradingKey
9 hours ago
International oil prices fell for a fourth consecutive trading day on Monday, marking their longest losing streak since June. Although Iranian-backed Houthi militants launched fresh attac
placeholder
Brent slides below $102 after Houthis' first strike on Riyadh — why oil can't hold $100Houthi forces struck Riyadh for the first time on September 19 and hit Yanbu facilities — yet Brent opened at $104.71, peaked at $104.90 and settled at $101.68 (-1.63% on the day). Here is the four-way data tug-of-war between strike escalation and supply recovery, and the two switches that decide where oil goes next.
Author  Irene Q.
15 hours ago
Houthi forces struck Riyadh for the first time on September 19 and hit Yanbu facilities — yet Brent opened at $104.71, peaked at $104.90 and settled at $101.68 (-1.63% on the day). Here is the four-way data tug-of-war between strike escalation and supply recovery, and the two switches that decide where oil goes next.
placeholder
Today’s Market Recap: AI Chip Stocks Gain, SanDisk Surges Nearly 11%, Micron Rises Nearly 4%, Bitcoin Reclaims $80,000Tracking Market TrendsTradingKey - On September 18, Eastern Time, U.S. stocks capped off a volatile week with the three major benchmarks closing mixed. Tech and semiconductor stocks extended their reb
Author  TradingKey
16 hours ago
Tracking Market TrendsTradingKey - On September 18, Eastern Time, U.S. stocks capped off a volatile week with the three major benchmarks closing mixed. Tech and semiconductor stocks extended their reb
placeholder
Bitcoin squeezes back above $80,000 — 110,000 traders liquidated as the hawkish Fed and CLARITY setback fail to hold it down; is $83,000 next?Bitcoin closed above $80,000 on Friday for the first time since September 7, and pushed to $81,299 over the weekend, triggering about $603 million of liquidations — $523 million of them shorts — across more than 110,000 traders. With the Fed's hike already priced and the SEC and CFTC advancing crypto rules after the CLARITY Act failed, here is what stands between BTC and the $83,000 gate.
Author  Suzie
Yesterday 06: 19
Bitcoin closed above $80,000 on Friday for the first time since September 7, and pushed to $81,299 over the weekend, triggering about $603 million of liquidations — $523 million of them shorts — across more than 110,000 traders. With the Fed's hike already priced and the SEC and CFTC advancing crypto rules after the CLARITY Act failed, here is what stands between BTC and the $83,000 gate.
Related Instrument
goTop
quote