


Binance Sees Massive Ethereum Whale Outflows: Demand Remains Strong
Ethereum has entered a consolidation phase after losing the $4,500 level, now trading within a tight range above $4,250. The recent pullback has increased uncertainty across the market, with investors weighing whether ETH will break lower or gather enough momentum to attempt another rally. Despite this volatility, Ethereum continues to demonstrate strong underlying fundamentals, supported by consistent whale and institutional accumulation.
According to top analyst Darkfost, whale activity on Ethereum remains elevated, with significant outflows recorded from Binance in recent sessions. These withdrawals highlight an important trend: whales are not selling but rather moving their ETH into decentralized finance ecosystems. In fact, several notable transactions were detected this morning, with large holders transferring ETH from Binance to Aave, deploying it for yield opportunities.
This ongoing accumulation and redeployment reflect a growing conviction among whales that Ethereum remains one of the most attractive assets in the market. By leveraging ETH in DeFi rather than offloading it, large players are signaling long-term confidence in Ethereum’s value. As the bullish trend quietly unfolds behind the scenes, the market’s consolidation may ultimately serve as a foundation for Ethereum’s next major move.
Whale Outflows Underscore Ethereum Strength
Ethereum whales have once again demonstrated their conviction with a series of large outflows from Binance. Within just a few minutes, three massive transactions were recorded: the first totaling roughly 23,000 ETH, the second a much larger 64,000 ETH, and the final outflow an extraordinary 83,000 ETH. Altogether, these movements represent nearly $750 million worth of Ethereum withdrawn from the exchange in a single burst of activity.
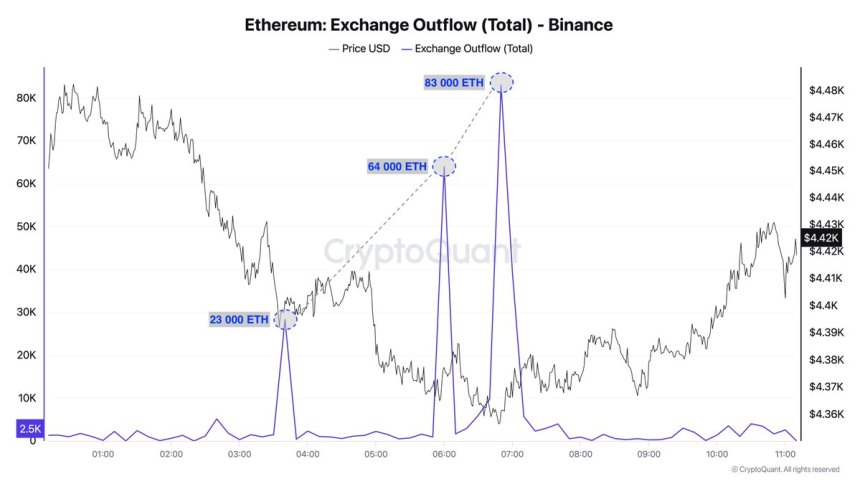
These outflows have had a measurable impact on Binance’s reserves. With this wave of withdrawals, the amount of ETH held on the exchange has fallen to 4.2 million ETH, highlighting a continued decline in centralized exchange balances. Historically, declining reserves have been viewed as a sign of strong demand, as coins are moved off exchanges and into long-term storage or deployed into decentralized finance platforms like Aave for yield.
The conviction displayed by whales in this instance sends a powerful signal to the market. Rather than reacting to short-term volatility, these large holders are positioning themselves for the long term, underscoring Ethereum’s resilience even during consolidation phases. This activity also explains why ETH has been outperforming Bitcoin recently—whale demand continues to funnel into Ethereum while Bitcoin faces more muted accumulation trends.
The strength of these outflows reflects the growing institutional and whale appetite for Ethereum. With reserves shrinking and demand proving consistent, the market may be setting the stage for Ethereum’s next breakout once broader conditions align.
Testing Key Supports Amid Sideways ActionEthereum (ETH) is currently trading around $4,381, consolidating after a volatile period that has kept price action capped below the $4,500 resistance zone. The chart shows ETH respecting the $4,300 area, with the 200-period SMA (red line) acting as a key structural support. As long as this level holds, Ethereum avoids a deeper correction.

Shorter moving averages provide insight into momentum. The 50 SMA (blue line) is converging with the 100 SMA (green line), reflecting sideways market conditions and a lack of clear direction. ETH has repeatedly tested the $4,450–$4,500 resistance zone over the past two weeks but has failed to close decisively above it, highlighting seller pressure.
For bulls, reclaiming $4,500 would be a critical step to reestablish momentum toward $4,700 and $5,000. On the downside, losing $4,300 could expose ETH to a retest of $4,200, with further weakness potentially dragging the price closer to $4,000.
Featured image from Dall-E, chart from TradingView
Recommended Articles


