

What’s Next For Bitcoin? Key Developments After Falling To $112,000

Source Newsbtc

The market’s leading cryptocurrency, Bitcoin (BTC), has recently attempted to stabilize around $112,000 after experiencing a sharp decline to $110,000 on Sunday, meaning a 10% drop from all-time high (ATH) levels. 

Ahead of the Federal Reserve’s (Fed) September meeting, market expert Doctor Profit highlighted on X (formerly Twitter) the upcoming implications and the most important technical indicators that paint a bleak picture for Bitcoin (BTC) and the broader market.

Fed Rate Cut To Trigger A New Market Correction?

Doctor Profit emphasized that the current market environment is markedly different from previous cycles. He believes that the anticipated rate cut by the Fed next month could initiate a robust correction in both stocks and cryptocurrencies. 

According to him, the first significant cut typically brings uncertainty, leading to divergent opinions among investors, and he predicts that this time will be no exception. 

Turning to Bitcoin’s technical indicators, the outlook appears bearish. The expert noted a substantial Chicago Mercantile Exchange (CME) gap around the $93,000 mark that needs addressing, with most liquidity concentrated in the $90,000 to $95,000 range. 
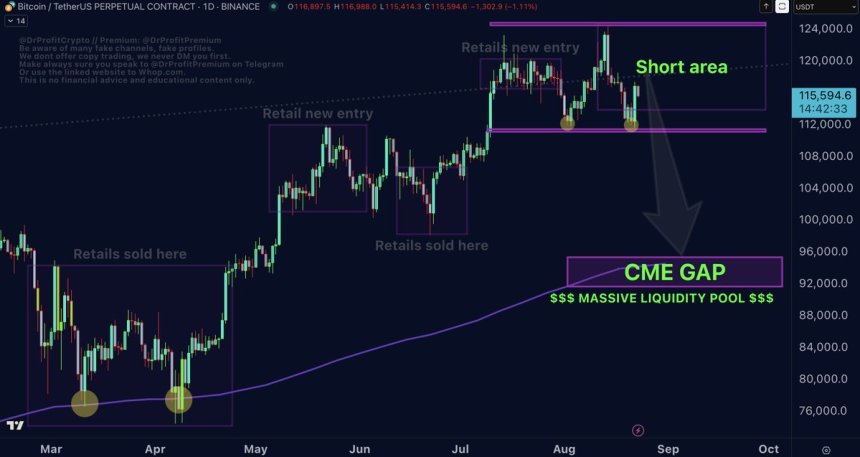
Bitcoin

The charts indicate a potential correction, highlighted by a double top formation and declining trading volume. Notably, Doctor Profit has asserted that the last price surge that saw BTC reach $124,000, was largely driven by futures rather than spot market activity, reinforcing the bearish sentiment.

Bitcoin Price Forecast

Market psychology plays a crucial role in this analysis. On-chain metrics and sentiment indicators reveal that retail investors often buy high and sell low. 

The expert disclosed that during Bitcoin’s last dip from $110,000 to $98,000 between May and June of this year, it was primarily institutional investors who capitalized on the lower prices, while retail buyers missed out. 

As prices climbed, retail investors entered the market at higher levels, Doctor Profit added, which could lead to a shakeout as Bitcoin approaches the critical liquidation zone of $90,000 to $95,000.

Beyond Bitcoin’s price action, Doctor Profit warns that the current market sentiment reflects a false sense of optimism, suggesting that the prevalent belief in a sustained altcoin season is misguided. He cautions that as enthusiasm grows, larger players may begin to offload their positions, leaving retail investors exposed.

Looking ahead, he forecasts a potential surge in Bitcoin prices towards $145,000 to $150,000, which could potentially mean a  34% increase from current levels. The expert also expects Ethereum (ETH) to reach between $7,000 and $8,000 following the September correction.

Bitcoin

When writing, Bitcoin trades at $112,560, recording a 6% drop in the fourteen-days time frame. Ethereum on the other hand, has continuously positioned among the market’s top performers with a 5% surge during the same period.  

Featured image from DALL-E, chart from TradingView.com 

Disclaimer: For information purposes only. Past performance is not indicative of future results.
placeholder
Anthropic files for a $2 trillion IPO — the $80.7 billion loss is the decoy, the $450 billion compute bill is the riskAnthropic publicly filed its S-1 on October 26, revealing $16.29 billion of first-half revenue (+1,304% year over year) and a $80.7 billion net loss — of which $72.4 billion is a non-cash convertible-note charge. The real number is the $450 billion of signed, mostly non-cancelable compute commitments. Here is what the filing says, why NVDA, ARM and MU are the tradeable read-through, and the conditions that decide whether the AI trade passes its first public valuation test.
Author  Irene Q.
Oct 27, Tue
Anthropic publicly filed its S-1 on October 26, revealing $16.29 billion of first-half revenue (+1,304% year over year) and a $80.7 billion net loss — of which $72.4 billion is a non-cash convertible-note charge. The real number is the $450 billion of signed, mostly non-cancelable compute commitments. Here is what the filing says, why NVDA, ARM and MU are the tradeable read-through, and the conditions that decide whether the AI trade passes its first public valuation test.
placeholder
Brent's $115 front month sits $4.6 above January — the $14 spread to WTI is the supply-risk premiumDecember Brent trades at $115.29 while January is $110.71, a $4.58 backwardation. The December Brent-WTI spread is $14.2, versus a $3-5 normal. That gap, not the headline, is where the Middle East supply risk is priced. Here is what the curve says, why the December contract's expiry on October 30 will mechanically cut the headline by $4.6, and the 108.81 neckline that decides the next move.
Author  Irene Q.
Oct 28, Wed
December Brent trades at $115.29 while January is $110.71, a $4.58 backwardation. The December Brent-WTI spread is $14.2, versus a $3-5 normal. That gap, not the headline, is where the Middle East supply risk is priced. Here is what the curve says, why the December contract's expiry on October 30 will mechanically cut the headline by $4.6, and the 108.81 neckline that decides the next move.
placeholder
Gold Price Analysis Today | Forex Gold Analysis | XAU/USD Analysis - October 29, 2026Get the latest gold price analysis, forex gold insights, and XAU/USD analysis for October 29, 2026. Read on for the details.
Author  Mitrade
Oct 29, Thu
Get the latest gold price analysis, forex gold insights, and XAU/USD analysis for October 29, 2026. Read on for the details.
placeholder
Gold Price Analysis Today | Forex Gold Analysis | XAU/USD Analysis - October 30, 2026Get the latest gold price analysis, forex gold insights, and XAU/USD analysis for October 30, 2026. Read on for the details.
Author  Mitrade
Oct 30, Fri
Get the latest gold price analysis, forex gold insights, and XAU/USD analysis for October 30, 2026. Read on for the details.
placeholder
US GDP grew 3.4% and core PCE held at 3.1% — December is now a hike trade, not a cut tradeUS Q3 GDP rose 3.4%, above the 3.1% estimate, while September headline PCE hit 3.6% and core held at 3.1%. December hike odds are near 90%; inventories, AI capex and energy explain why.
Author  Irene Q.
Oct 30, Fri
US Q3 GDP rose 3.4%, above the 3.1% estimate, while September headline PCE hit 3.6% and core held at 3.1%. December hike odds are near 90%; inventories, AI capex and energy explain why.
goTop
quote