


Cardano Price Forecast: ADA flaunts bullish structure, targeting $1.00 as open interest surges
- Cardano extends uptrend alongside altcoin majors as bulls target breakout above $1.00.
- Cardano futures Open Interest rises to $1.43 billion, underscoring growing retail demand.
- ADA’s technical outlook leans bullish, backed by a MACD buy signal and rising trading volume.
Cardano (ADA) offers bullish signals on Wednesday underpinned by strong sentiment in the broader cryptocurrency market. ADA exchanges hands at around $0.87, up over 4% at the time of writing.
The path of least resistance is upward amid a bullish technical structure, but first, Cardano should break above a key descending trendline that has capped its upside since December.
Cardano rebounds as open interest soars
The Cardano derivatives market reflects the bullish outlook in the spot market, as the futures Open Interest (OI) surges to $1.43 billion on Tuesday from the $1.2 billion recorded on August 3, when ADA declined and tested support at $0.68.
A steady increase in OI, which represents the notional value of outstanding futures or options contracts, indicates growing interest in ADA. During the rally in July to highs of $0.93, OI surged, peaking at $1.74 billion before shrinking as investors booked profits amid worsening sentiment across the market.
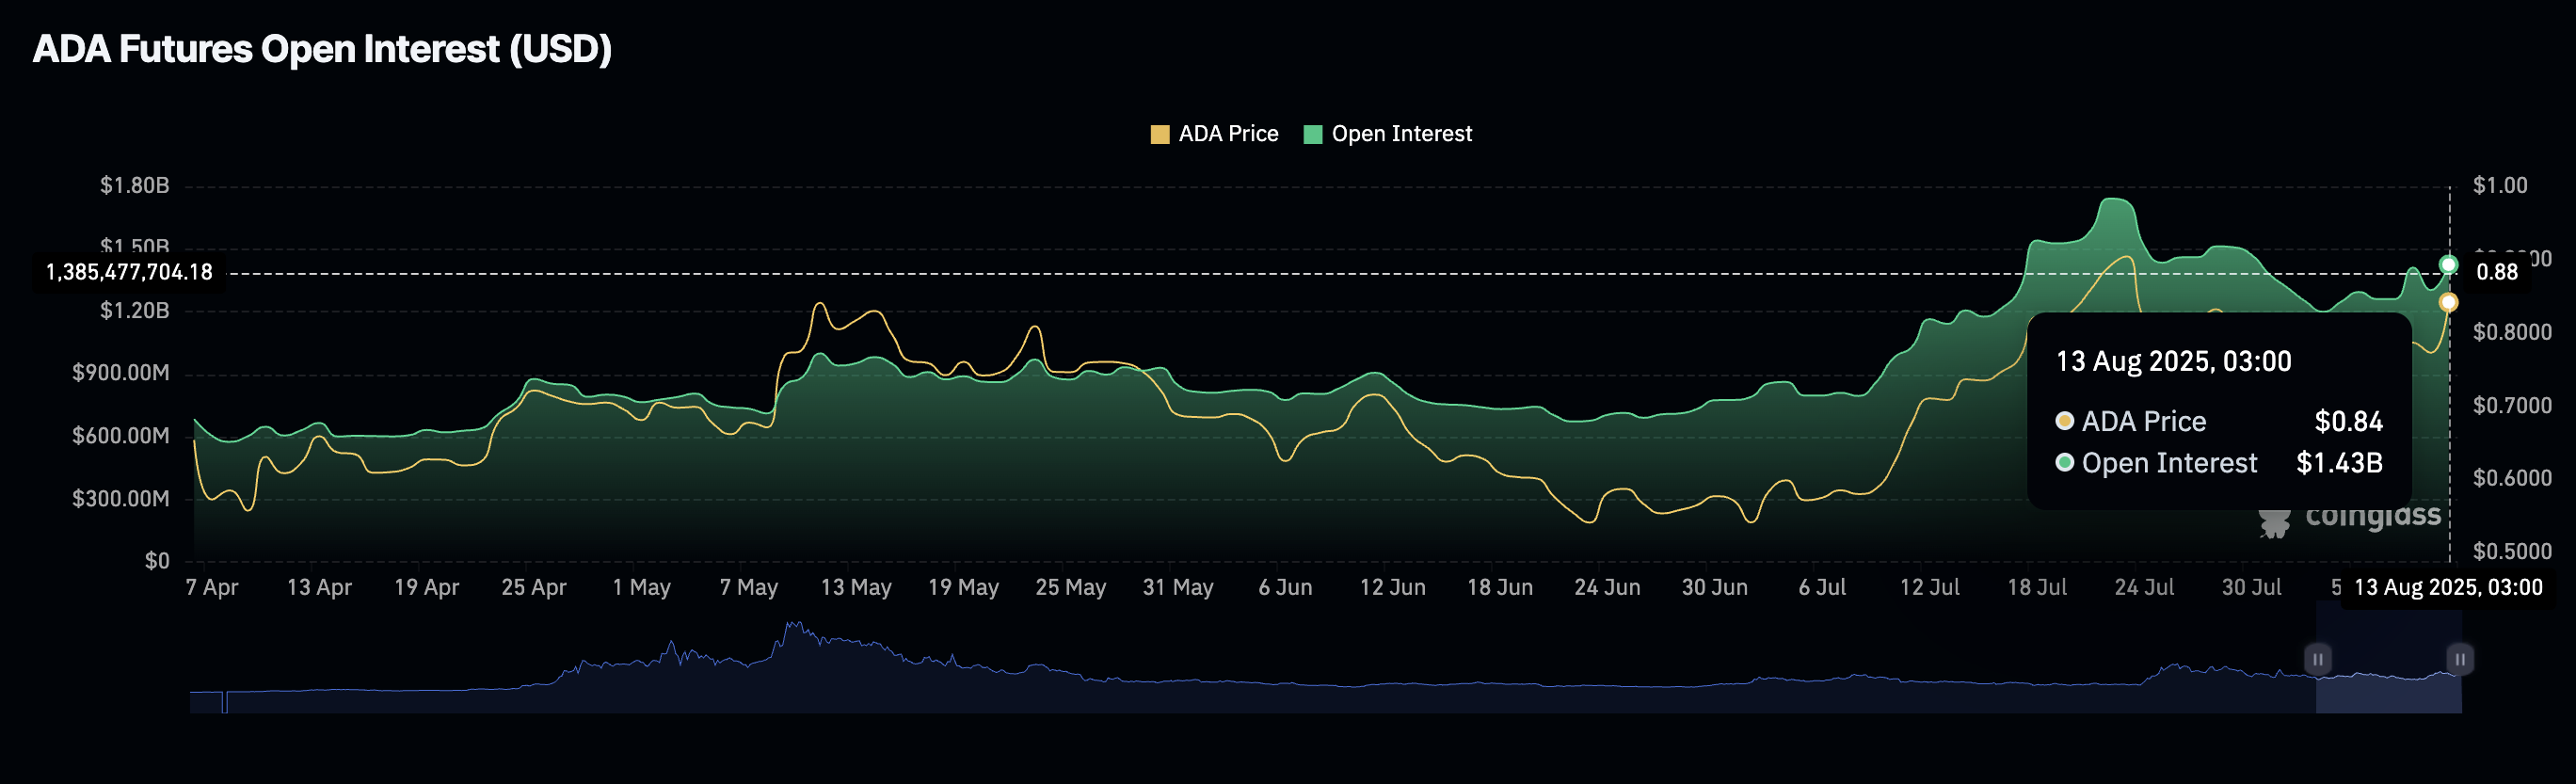
Cardano Futures Open Interest | Source: CoinGlass
CoinGlass data shows that liquidations over the last 24 hours totaled $3.35 million. Short position holders accounted for the lion’s share of the liquidations at $2.4 million compared to approximately $916,500 in longs.
The surge in short position liquidations as the price of ADA increases backs the smart contracts token’s bullish case. A long-to-short ratio of 1.0153 underlines that more traders are leveraging long positions in ADA.
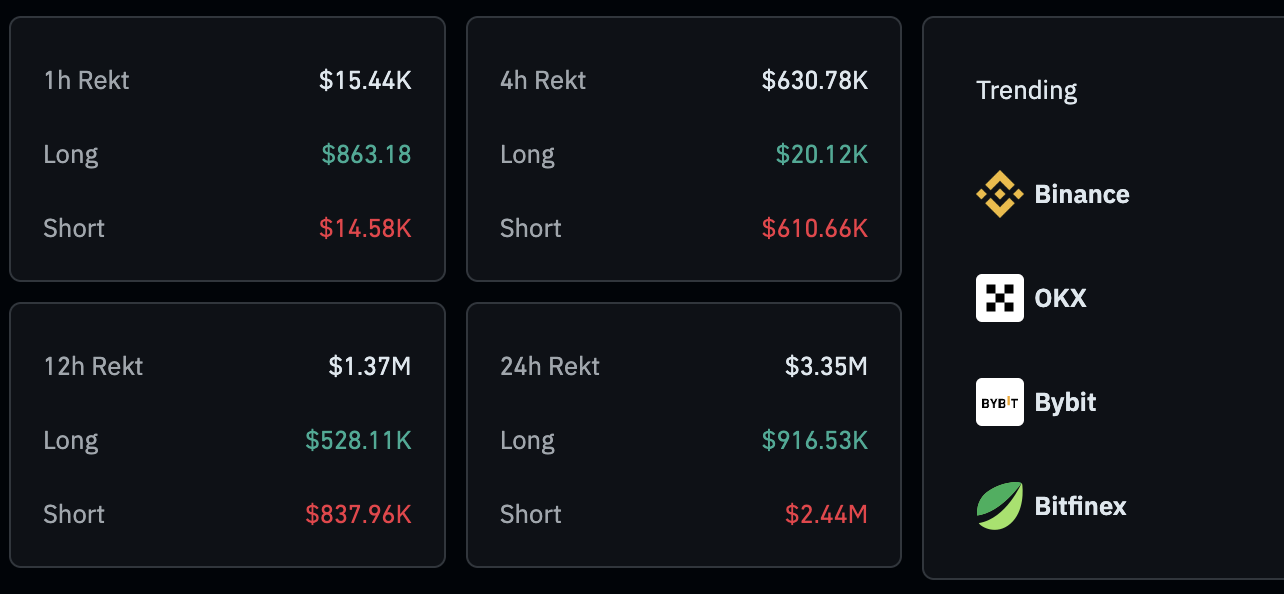
Cardano liquidations data | Source: CoinGlass
Technical outlook: Cardano bulls eye trendline breakout
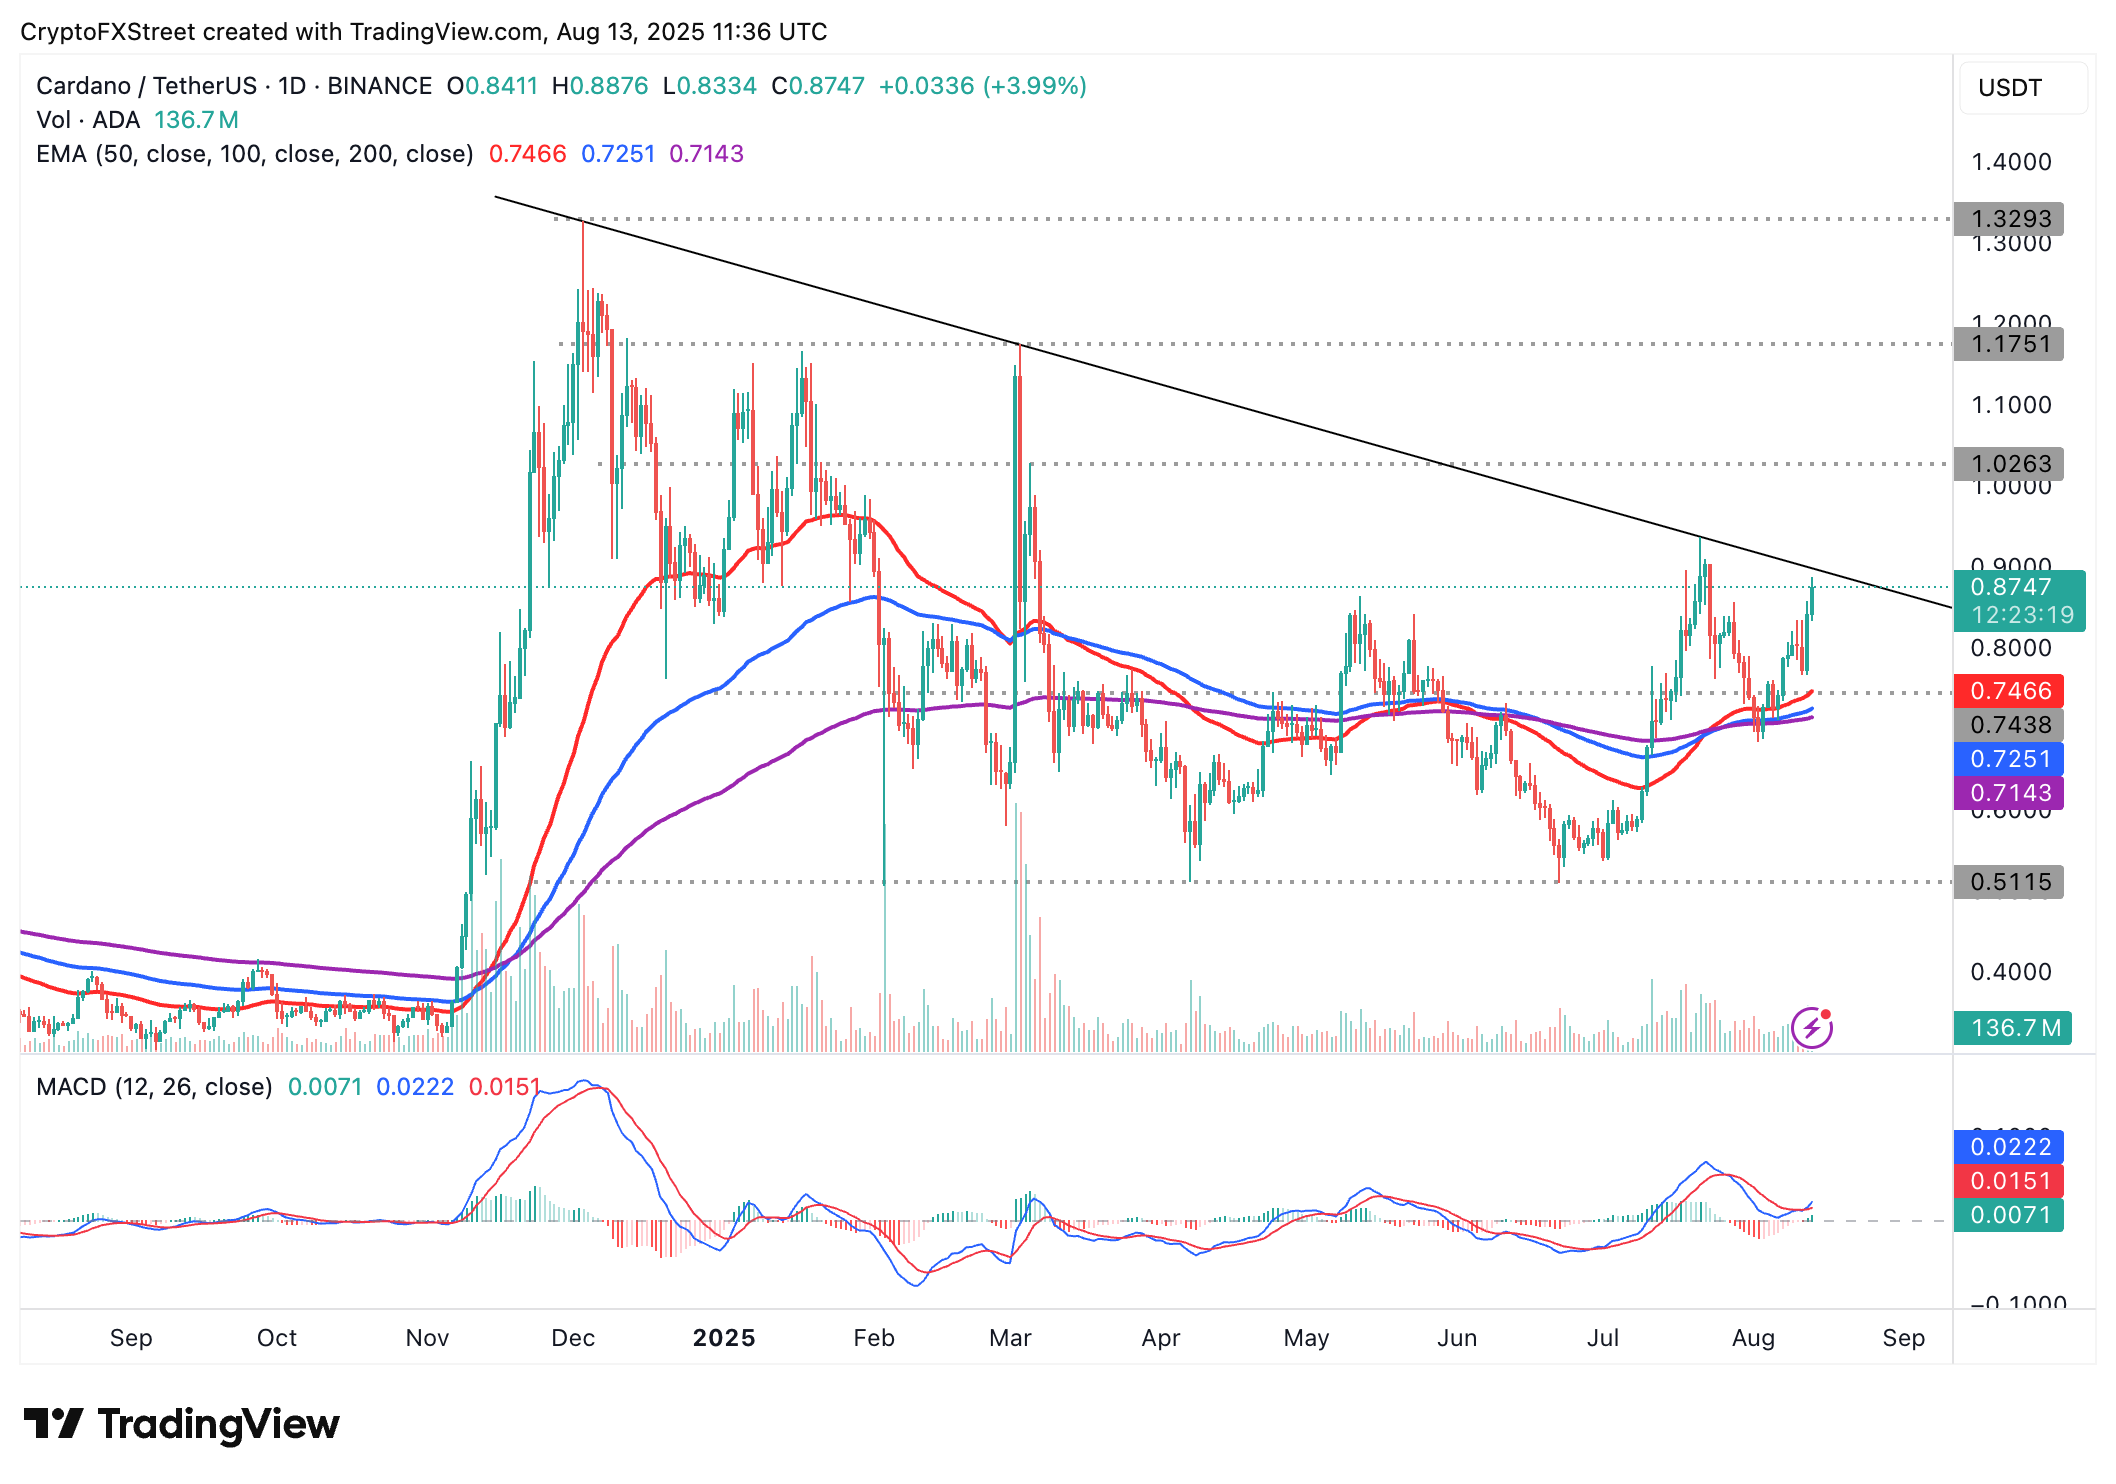
Cardano is trading below a multi-month trendline, which has capped price movement since December’s local top of $1.32. A break above this would significantly ramp up bets on ADA’s ability to close the gap to the $1.00 level.
Backing the bullish structure is a buy signal from the Moving Average Convergence Divergence (MACD) indicator triggered on Tuesday, when the blue line crossed above the red signal line.
This buy signal affirms Cardano’s bullish outlook and encourages investors to seek exposure. With interest in the token rising, as evidenced by the futures open interest above, speculative demand could drive the next recovery phase past the $1.00 mark.
ADA/USDT daily chart
Several Golden Cross patterns validated in July support risk-on sentiment. A Golden Cross occurs when a shorter-term moving average crosses above a longer-term moving average.
The 50-day Exponential Moving Average (EMA) crossed above the 100-day EMA and subsequently flipped the 200-day EMA in late July, encouraging risk-on sentiment. The third Golden Cross appeared with the 100-day EMA crossing above the 200-day EMA in early August.
In the event potential profit-taking delays the breakout at the trendline resistance and a trend correction occurs, traders will turn to the 50-day EMA at $0.74, the 100-day EMA at $0.72 and the 200-day EMA at $0.71 as tentative support levels.
Open Interest, funding rate FAQs
Higher Open Interest is associated with higher liquidity and new capital inflow to the market. This is considered the equivalent of increase in efficiency and the ongoing trend continues. When Open Interest decreases, it is considered a sign of liquidation in the market, investors are leaving and the overall demand for an asset is on a decline, fueling a bearish sentiment among investors.
Funding fees bridge the difference between spot prices and prices of futures contracts of an asset by increasing liquidation risks faced by traders. A consistently high and positive funding rate implies there is a bullish sentiment among market participants and there is an expectation of a price hike. A consistently negative funding rate for an asset implies a bearish sentiment, indicating that traders expect the cryptocurrency’s price to fall and a bearish trend reversal is likely to occur.
Recommended Articles


