

XRP Price at Risk of Correction – Bulls Losing Steam?

Source Newsbtc

XRP price started a decent increase above $3.00 zone. The price is now facing resistance at $3.10 and might correct some gains in the near term.

  • XRP price is attempting to start a fresh increase above the $3.00 zone.
  • The price is now trading above $2.980 and the 100-hourly Simple Moving Average.
  • There was a break below a bullish trend line with support at $3.065 on the hourly chart of the XRP/USD pair (data source from Kraken).
  • The pair could start another increase if it stays above the $2.920 zone.

XRP Price Faces Resistance

XRP price started a fresh increase above the $2.820 zone, beating Bitcoin and Ethereum. The price was able to surpass the $2.920 and $2.950 resistance levels.

The price even cleared the $3.00 resistance level. Finally, the bears appeared near the $3.10 zone. A high was formed at $3.106 and the price is now correcting gains. There was a break below a bullish trend line with support at $3.065 on the hourly chart of the XRP/USD pair.

The price is now trading above $3.00 and the 100-hourly Simple Moving Average. It is also above the 23.6% Fib retracement level of the upward move from the $2.730 swing low to the $3.106 high.
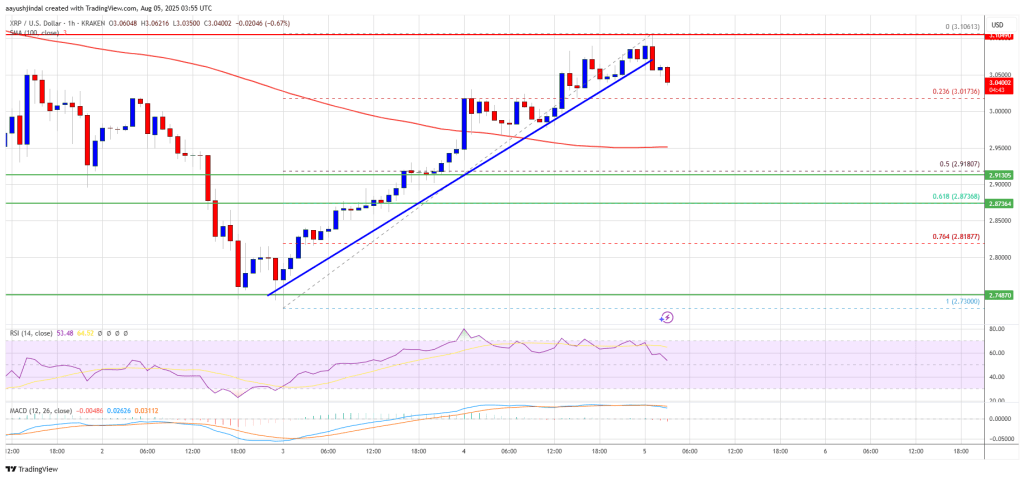
XRP Price

On the upside, the price might face resistance near the $3.10 level. The first major resistance is near the $3.120 level. A clear move above the $3.120 resistance might send the price toward the $3.150 resistance. Any more gains might send the price toward the $3.20 resistance or even $3.2120 in the near term. The next major hurdle for the bulls might be near the $3.250 zone.

Another Drop?

If XRP fails to clear the $3.10 resistance zone, it could start another decline. Initial support on the downside is near the $3.00 level. The next major support is near the $2.950 level.

If there is a downside break and a close below the $2.950 level, the price might continue to decline toward the $2.920 support and the 50% Fib retracement level of the upward move from the $2.730 swing low to the $3.106 high. The next major support sits near the $2.880 zone where the bulls might take a stand.

Technical Indicators

Hourly MACD – The MACD for XRP/USD is now losing pace in the bullish zone.

Hourly RSI (Relative Strength Index) – The RSI for XRP/USD is now above the 50 level.

Major Support Levels – $3.00 and $2.920.

Major Resistance Levels – $3.10 and $3.120.

Disclaimer: For information purposes only. Past performance is not indicative of future results.
placeholder
Tesla jumps 5% as Barclays puts a $450 target on the SpaceX merger — the chart was already pointing to 431Tesla closed at $391.62 on October 26, up 5.21%, after Barclays upgraded the stock to Overweight and lifted its target to $450 from $370, citing a sharp inflection in Robotaxi miles and a potential SpaceX merger. The move also completed a double bottom at $345.88 and $349.33, with a neckline at $388.56 and a measured target of $431.24. Here is what the upgrade actually says, why the chart and the analyst now point the same way, and what would break the target.
Author  Irene Q.
Oct 27, Tue
Tesla closed at $391.62 on October 26, up 5.21%, after Barclays upgraded the stock to Overweight and lifted its target to $450 from $370, citing a sharp inflection in Robotaxi miles and a potential SpaceX merger. The move also completed a double bottom at $345.88 and $349.33, with a neckline at $388.56 and a measured target of $431.24. Here is what the upgrade actually says, why the chart and the analyst now point the same way, and what would break the target.
placeholder
Brent's $115 front month sits $4.6 above January — the $14 spread to WTI is the supply-risk premiumDecember Brent trades at $115.29 while January is $110.71, a $4.58 backwardation. The December Brent-WTI spread is $14.2, versus a $3-5 normal. That gap, not the headline, is where the Middle East supply risk is priced. Here is what the curve says, why the December contract's expiry on October 30 will mechanically cut the headline by $4.6, and the 108.81 neckline that decides the next move.
Author  Irene Q.
Oct 28, Wed
December Brent trades at $115.29 while January is $110.71, a $4.58 backwardation. The December Brent-WTI spread is $14.2, versus a $3-5 normal. That gap, not the headline, is where the Middle East supply risk is priced. Here is what the curve says, why the December contract's expiry on October 30 will mechanically cut the headline by $4.6, and the 108.81 neckline that decides the next move.
placeholder
Gold Price Analysis Today | Forex Gold Analysis | XAU/USD Analysis - October 30, 2026Get the latest gold price analysis, forex gold insights, and XAU/USD analysis for October 30, 2026. Read on for the details.
Author  Mitrade
Oct 30, Fri
Get the latest gold price analysis, forex gold insights, and XAU/USD analysis for October 30, 2026. Read on for the details.
placeholder
US GDP grew 3.4% and core PCE held at 3.1% — December is now a hike trade, not a cut tradeUS Q3 GDP rose 3.4%, above the 3.1% estimate, while September headline PCE hit 3.6% and core held at 3.1%. December hike odds are near 90%; inventories, AI capex and energy explain why.
Author  Irene Q.
Oct 30, Fri
US Q3 GDP rose 3.4%, above the 3.1% estimate, while September headline PCE hit 3.6% and core held at 3.1%. December hike odds are near 90%; inventories, AI capex and energy explain why.
placeholder
Gold Price Analysis Today | Forex Gold Analysis | XAU/USD Analysis - November 2, 2026Get the latest gold price analysis, forex gold insights, and XAU/USD analysis for November 2, 2026. Read on for the details.
Author  Mitrade
1 hour ago
Get the latest gold price analysis, forex gold insights, and XAU/USD analysis for November 2, 2026. Read on for the details.
goTop
quote