

Pundit Says Ethereum Price Is Headed For $9,000 After This Broadening Wedge Retest

Source Newsbtc

Earlier last week, the Ethereum price was retracing severely, giving up a fraction of the gains garnered from the previous bull rally. Despite this brief show of weakness, a crypto pundit forecasts that the leading altcoin may be on the brink of an explosive rally toward a new all-time high of $9,000. This bullish projection is based on the completion of a Broadening Wedge formation and an ongoing retest of the pattern’s upper boundary, which may now act as support. 

Ethereum Price Chart Signals Major Breakout

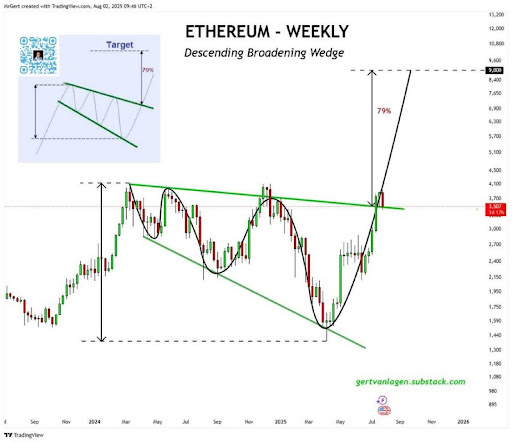
According to the new technical analysis released by crypto market expert Gert van Lagen on X social media, Ethereum could be gearing up for a major breakout move, with price action potentially targeting upper bullish levels around $9,000. This report is based on a key chart pattern, the Descending Broadening Wedge, which has historically proven to be a powerful bullish continuation setup.

On the weekly timeframe, Ethereum has completed a breakout above the upper resistance of the long-standing Descending Broadening Wedge pattern. After its initial breakout attempt, Lagen notes that Ethereum is now retesting the former resistance trendline, which has flipped into potential support. This retest is considered critical, with the analyst highlighting it as ETH’s second attempt to break higher while sustaining its bullish momentum.
Ethereum

The technical setup, as outlined by Lagen’s price chart, shows a projected upside of 79% from the breakout point, which could send Ethereum soaring toward the $9,000 level. Lagen highlights that statistically, such patterns resolve upward 67% of the time, reinforcing ETH’s bullish outlook. 

The price zone also aligns with a historical sell line—an area where traders may begin taking profits as the cryptocurrency approaches upper targets. Interestingly, Lagen notes that the Bitcoin price has previously formed a similar Descending Broadening Wedge structure. At the time, the analyst had predicted that a successful retest of the pattern’s upper boundary could trigger a massive surge to $230,000 for Bitcoin. This historical parallel reinforces the belief that Ethereum could be on the verge of a similar upward trajectory if the current retest confirms support. 

Analyst Sees ETH Surpassing $5,000 This August

Despite ETH’s brief pullback, August is shaping up to be a potentially explosive month for the leading altcoin. Market expert, ‘Crypto GEMs’ on X, predicts that Ethereum will break past $5,000 before the month is over. The analyst’s technical chart shows a strong bullish setup forming after Ethereum’s brief price correction.

Currently, ETH is trading around $3,554 following a steep drop from its July highs of around $3,900. While this decline may appear concerning to some, Crypto GEMs sees it as a golden buying opportunity. The analyst encourages traders to take advantage of lower prices and “buy the dip”, as ETH positions for its next potential leg up.

Ethereum
Disclaimer: For information purposes only. Past performance is not indicative of future results.
placeholder
China's factories are pricing in 5.7%. Its shoppers are pricing in 0.7%.China's October PPI rose 5.7% year on year, the fastest since June 2022, while CPI slowed to 0.7% and core CPI to 0.8%. Input prices rose faster than factory-gate prices, squeezing mid-stream margins by roughly five percentage points. The Hang Seng fell 0.13% on a day the S&P 500 rose 2.35%, the only major market to sit out the risk-on session.
Author  Irene Q.
Nov 10, Tue
China's October PPI rose 5.7% year on year, the fastest since June 2022, while CPI slowed to 0.7% and core CPI to 0.8%. Input prices rose faster than factory-gate prices, squeezing mid-stream margins by roughly five percentage points. The Hang Seng fell 0.13% on a day the S&P 500 rose 2.35%, the only major market to sit out the risk-on session.
placeholder
Gold Price Analysis Today | Forex Gold Analysis | XAU/USD Analysis - November 11, 2026Get the latest gold price analysis, forex gold insights, and XAU/USD analysis for November 11, 2026. Read on for the details.
Author  Mitrade
Nov 11, Wed
Get the latest gold price analysis, forex gold insights, and XAU/USD analysis for November 11, 2026. Read on for the details.
placeholder
Gold Extends Slide Below $4,000 as Rising US Inflation, Fed December Hike Bets Pressure Prices On November 12, gold prices (XAUUSD) extended their recent losses, falling further below $4,000 in early Asian trading to hit an intraday low near $3,968, marking a third consecutive day
Author  TradingKey
Yesterday 02: 00
On November 12, gold prices (XAUUSD) extended their recent losses, falling further below $4,000 in early Asian trading to hit an intraday low near $3,968, marking a third consecutive day
placeholder
Gold closed below $4,000 again — the ETF crowd and central banks stayed, the momentum money leftSpot gold is trading near $3,999, its third consecutive lower daily low, after a 5.00% 10-year yield and a 102.85 dollar index raised the odds of a December hike to 87%. But the selling is not coming from the strategic holders: managed-money net longs fell to 324 tonnes, a 21-week low, and Goldman Sachs attributes roughly 95% of five weeks of selling to non-reportable positions. ETFs still hold a record 4,256 tonnes and central banks bought 321 tonnes in Q3. The table below sets the triggers, directions and levels.
Author  Irene Q.
Yesterday 03: 20
Spot gold is trading near $3,999, its third consecutive lower daily low, after a 5.00% 10-year yield and a 102.85 dollar index raised the odds of a December hike to 87%. But the selling is not coming from the strategic holders: managed-money net longs fell to 324 tonnes, a 21-week low, and Goldman Sachs attributes roughly 95% of five weeks of selling to non-reportable positions. ETFs still hold a record 4,256 tonnes and central banks bought 321 tonnes in Q3. The table below sets the triggers, directions and levels.
placeholder
US October PPI Preview: Fed Rate Hike Expectations Rise, PPI May Be Key Variable; How Will US Stocks, Dollar, and Gold Move?On Friday (Nov. 13) Eastern Time, the U.S. will release the October Producer Price Index (PPI). Following the October CPI once again exceeding expectations, the market will look to the PP
Author  TradingKey
Yesterday 08: 36
On Friday (Nov. 13) Eastern Time, the U.S. will release the October Producer Price Index (PPI). Following the October CPI once again exceeding expectations, the market will look to the PP
goTop
quote