


Dow Jones Industrial Average gives back recent gains as ceasefire doubts resurface
- The Dow shed nearly 300 points on Friday as geopolitical jitters returned to the fore.
- March Consumer Price Index data came in as expected at 3.3% YoY, but remains well above the Fed's 2% target, keeping rate cut bets on ice.
- University of Michigan consumer sentiment collapsed to a record-low 47.6 in the preliminary April reading.
- Vice President Vance is heading to Islamabad for weekend peace talks with Iran, keeping traders on edge.
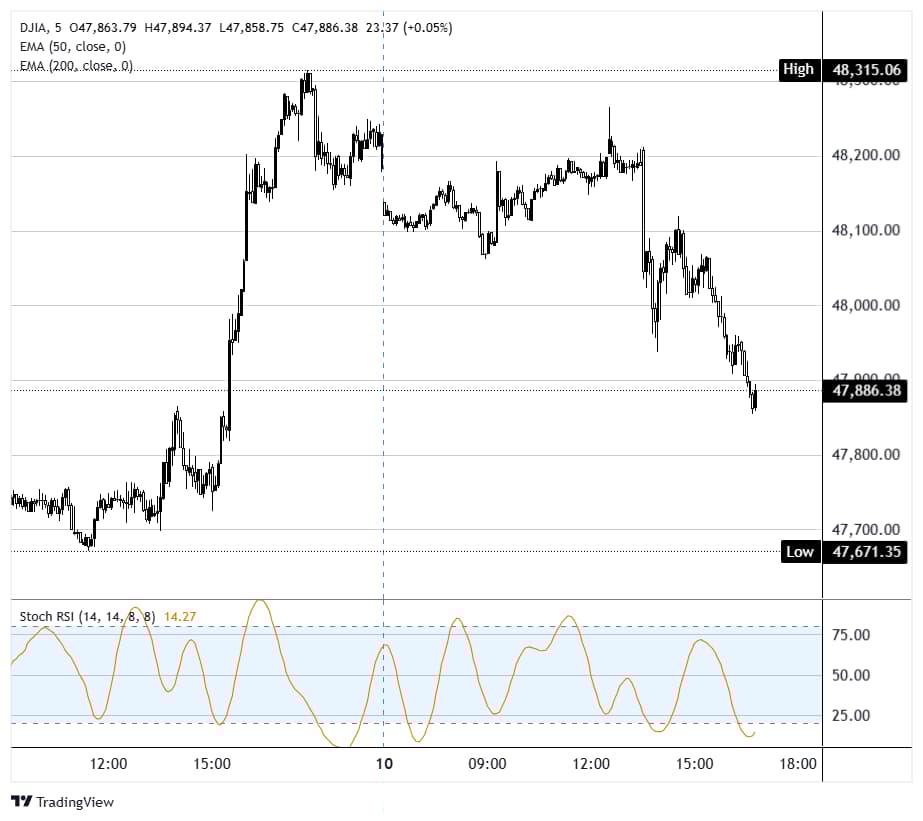
The Dow Jones Industrial Average slumped around 300 points on Friday, or roughly 0.6%, retreating from the 48,000 handle after two sessions of ceasefire-fueled gains. The S&P 500 dipped 0.15% while the Nasdaq Composite bucked the trend, edging 0.2% higher as mega-cap tech provided a thin buffer against the broader selloff. The reversal came as fresh cracks in the US-Iran ceasefire spooked a market that had only just started to relax.
Ceasefire optimism fades fast
The two-week ceasefire between the US and Iran, announced on April 7, is already looking shaky. President Trump accused Iran of "doing a very poor job" of reopening the Strait of Hormuz, with only a handful of tankers allowed through since the deal was struck. Trump also warned Iran against charging fees to oil tankers transiting the strait. Overnight, Israel and Iran-backed Hezbollah exchanged strikes in Lebanon, further undermining confidence in the agreement. Tehran's parliamentary speaker cited Israel's continued attacks on Lebanon as a violation of the ceasefire terms. On the other side, Israeli Prime Minister Netanyahu said the country had agreed to negotiate with Lebanon, which helped stocks hold gains on Thursday. Vice President JD Vance departed for Islamabad on Friday to lead weekend negotiations, telling reporters the talks would be "positive" but warning that Iran would face consequences if it tried to "play" the US. Markets rallied hard on the ceasefire announcement earlier in the week, with the Dow posting its best single-day gain since April 2025 on Wednesday, so Friday's pullback reflects a natural unwinding of what was always a fragile trade.
Hot CPI lands but core stays tame
The Bureau of Labor Statistics (BLS) reported that the Consumer Price Index (CPI) rose 0.9% MoM in March, pushing the annual rate to 3.3% YoY, the highest since May 2024. Both figures landed exactly in line with consensus, but the headline number is still running well above the Fed's 2% target, and that reality continues to hamper rate cut expectations. The spike was driven by a 10.9% jump in energy costs as the Iran conflict choked supply through the Strait of Hormuz, with gasoline prices alone surging over 21%. Stripping out food and energy, core CPI rose just 0.2% MoM and 2.6% YoY, actually coming in below expectations. Inflation had been sticky around 3% heading into the war, so the core print offers some reassurance that underlying price pressures have not deteriorated further. Tim Holland, chief investment officer at Orion, noted that the Fed will likely try to look past whatever data comes in for March and April, assuming there is an eventual off-ramp between the US, Israel, and Iran. With the Fed funds rate sitting at 3.5%-3.75% and the March dot plot showing only one cut expected this year, policymakers have some room to look through energy-driven noise, but that patience has limits if Oil stays elevated and the war premium starts bleeding into core components.
Consumer sentiment hits rock bottom
The University of Michigan's (UoM) preliminary April consumer sentiment index cratered to 47.6, well below the 52.0 consensus and down from 53.3 in March. If confirmed, that would be the lowest reading on record, surpassing the trough hit during peak Biden-era inflation. One-year inflation expectations spiked to 4.8% from 3.8%, the biggest monthly jump since April 2025, while long-run expectations ticked up to 3.4%. Notably, 98% of survey responses were collected before the ceasefire announcement, so the next reading should capture any relief effect. Still, the damage to household confidence is real, with consumers citing soaring gas prices and volatile asset values as primary concerns.
Oil stays front and center
West Texas Intermediate (WTI) was last trading near $99 a barrel on Friday, with international benchmark Brent above $96. The ceasefire was supposed to ease the energy shock that has defined markets since the conflict began on February 28, but Iran's foot-dragging on Strait of Hormuz access has kept the war premium firmly intact. Gasoline at $4.30 per gallon is squeezing consumers and feeding directly into the inflation data. Airlines, which had rallied earlier in the week on hopes of cheaper jet fuel, gave back some gains. Until there is a verifiable, sustained reopening of shipping lanes, Oil is going to remain the dominant macro variable.
Dow Jones 5-minute chart
Dow Jones FAQs
The Dow Jones Industrial Average, one of the oldest stock market indices in the world, is compiled of the 30 most traded stocks in the US. The index is price-weighted rather than weighted by capitalization. It is calculated by summing the prices of the constituent stocks and dividing them by a factor, currently 0.152. The index was founded by Charles Dow, who also founded the Wall Street Journal. In later years it has been criticized for not being broadly representative enough because it only tracks 30 conglomerates, unlike broader indices such as the S&P 500.
Many different factors drive the Dow Jones Industrial Average (DJIA). The aggregate performance of the component companies revealed in quarterly company earnings reports is the main one. US and global macroeconomic data also contributes as it impacts on investor sentiment. The level of interest rates, set by the Federal Reserve (Fed), also influences the DJIA as it affects the cost of credit, on which many corporations are heavily reliant. Therefore, inflation can be a major driver as well as other metrics which impact the Fed decisions.
Dow Theory is a method for identifying the primary trend of the stock market developed by Charles Dow. A key step is to compare the direction of the Dow Jones Industrial Average (DJIA) and the Dow Jones Transportation Average (DJTA) and only follow trends where both are moving in the same direction. Volume is a confirmatory criteria. The theory uses elements of peak and trough analysis. Dow’s theory posits three trend phases: accumulation, when smart money starts buying or selling; public participation, when the wider public joins in; and distribution, when the smart money exits.
There are a number of ways to trade the DJIA. One is to use ETFs which allow investors to trade the DJIA as a single security, rather than having to buy shares in all 30 constituent companies. A leading example is the SPDR Dow Jones Industrial Average ETF (DIA). DJIA futures contracts enable traders to speculate on the future value of the index and Options provide the right, but not the obligation, to buy or sell the index at a predetermined price in the future. Mutual funds enable investors to buy a share of a diversified portfolio of DJIA stocks thus providing exposure to the overall index.
Recommended Articles


