

Silver Price Forecast: XAG/USD corrects as White House softens stance on US-China trade relations
- Silver price retraces to near $33.30 on hopes of de-escalation in US-China trade war.
- The demand of Silver as industrial metal will increase if the US and China ends tariff war.
- China wants the US to cancel unilateral tariff measures before coming to the table.
Silver price (XAG/USD) retraces to near $33.30 during North American trading hours on Thursday from an almost three-week high of $33.70 posted earlier in the day. The white metal corrects as investors become hopeful of significant de-escalation in trade war between the United States (US) and China.
Investors’ confidence on normalizing trade relations between the world’s two largest powerhouses increased after US President Donald Trump assured of making a deal with Beijing. Discussions with Beijing are going well, and I think that we will reach a deal,” Trump said on Tuesday.
Additionally, US Treasury Secretary Scott Bessent has signaled that both nations can reduce additional tariffs imposed recently. “I don’t think either side believes that the current tariff levels are sustainable, so I would not be surprised if they went down in a mutual way,” Bessent said on Wednesday.
A report from the Wall Street Journal (WSJ) showed on Wednesday that the White House can lower additional import duties roughly between 50%-65%.
Meanwhile, China has given ultimatum to the US to “completely cancel all unilateral tariff measures” if it wants trade talks, according to a spokesperson from Chinese commerce ministry, Financial Times (FT) reported.
Positive comments from Washington for resolving trade disputes between the US and China have diminished fears of a global economic turmoil. Theoretically, the scenario weighs on the safe-haven demand of the Silver price. However, improving relations between them increase the demand of Silver as industrial metal.
Silver has application in various industries, such as Electric Vehicles (EV), electronic alliances, power and cables, mining etc.
Silver technical analysis
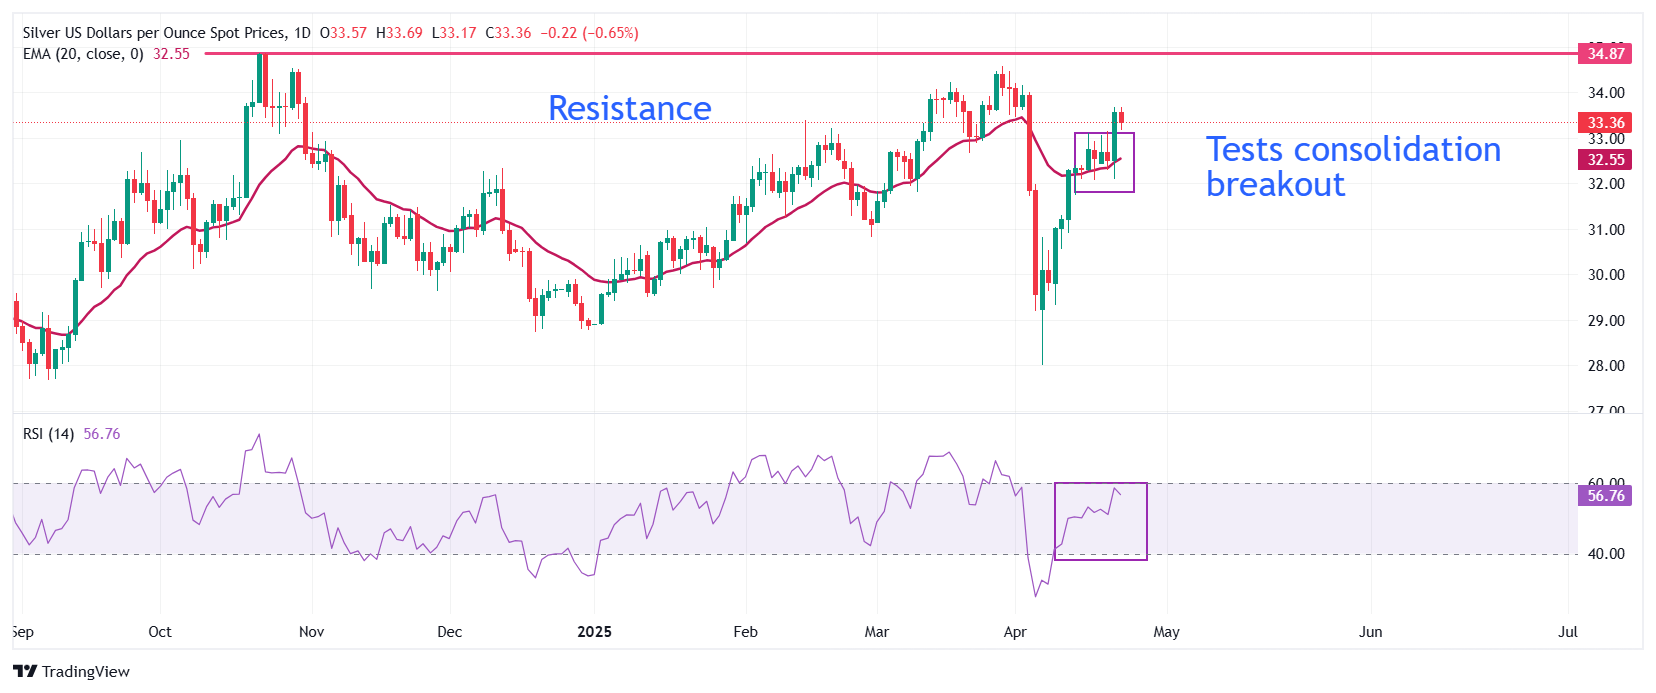
Silver price tests the breakout region of the consolidation around $33.10 formed on the daily timeframe. The 20-day Exponential Moving Average (EMA) near $32.55 continues to provide support to the Silver price.
The 14-day Relative Strength Index (RSI) reaches near 60.00. A fresh bullish momentum would emerge if the RSI breaks above 60.00.
Looking up, the March 28 high of $34.60 will act as key resistance for the metal. On the downside, the April 11 low of $30.90 will be the key support zone.
Silver daily chart
Silver FAQs
Silver is a precious metal highly traded among investors. It has been historically used as a store of value and a medium of exchange. Although less popular than Gold, traders may turn to Silver to diversify their investment portfolio, for its intrinsic value or as a potential hedge during high-inflation periods. Investors can buy physical Silver, in coins or in bars, or trade it through vehicles such as Exchange Traded Funds, which track its price on international markets.
Silver prices can move due to a wide range of factors. Geopolitical instability or fears of a deep recession can make Silver price escalate due to its safe-haven status, although to a lesser extent than Gold's. As a yieldless asset, Silver tends to rise with lower interest rates. Its moves also depend on how the US Dollar (USD) behaves as the asset is priced in dollars (XAG/USD). A strong Dollar tends to keep the price of Silver at bay, whereas a weaker Dollar is likely to propel prices up. Other factors such as investment demand, mining supply – Silver is much more abundant than Gold – and recycling rates can also affect prices.
Silver is widely used in industry, particularly in sectors such as electronics or solar energy, as it has one of the highest electric conductivity of all metals – more than Copper and Gold. A surge in demand can increase prices, while a decline tends to lower them. Dynamics in the US, Chinese and Indian economies can also contribute to price swings: for the US and particularly China, their big industrial sectors use Silver in various processes; in India, consumers’ demand for the precious metal for jewellery also plays a key role in setting prices.
Silver prices tend to follow Gold's moves. When Gold prices rise, Silver typically follows suit, as their status as safe-haven assets is similar. The Gold/Silver ratio, which shows the number of ounces of Silver needed to equal the value of one ounce of Gold, may help to determine the relative valuation between both metals. Some investors may consider a high ratio as an indicator that Silver is undervalued, or Gold is overvalued. On the contrary, a low ratio might suggest that Gold is undervalued relative to Silver.
Recommended Articles


