


Gold price retraces as China’s stimulus disappoints amid buoyant US Dollar
- Gold slips as China’s stimulus efforts fail to ease deflationary pressures.
- Minneapolis Fed President Kashkari’s comments on modest rate cuts and a strong labor market further support the Greenback.
- Geopolitical tensions, including Israel’s response to Hezbollah and Iran, continue to influence Bullion prices, with traders eyeing US economic data later this week.
Gold price retraces after hitting a daily high of $2,666 on Monday as China’s stimulus failed to provide relief to the financial markets and the Greenback extended its advance. The XAU/USD trades at $2,650, down some 0.26% at the time of writing.
Over the weekend, data revealed that China’s economy faces deflationary pressure that threatens to derail it from achieving the 5% Gross Domestic Product (GDP) goal. Regarding this, China’s Finance Minister Lan Foan announced that the government will continue providing stimulus, supporting the property market and replenishing state bank capital to boost the economy.
In the meantime, the US bond market remains closed in observance of Columbus Day, yet Bullion prices slipped amid a strong buck.
The US Dollar Index (DXY), which tracks the Greenback’s value against a basket of six currencies, edged up 0.38% to 103.30, its highest level since early August 2024.
Earlier, Minneapolis Fed President Neel Kashkari revealed that he expected “further modest reductions in our policy rate.” He added that recent jobs data shows a strong labor market and that the economy is finally bringing inflation back to 2%.
Meanwhile, geopolitics will continue to play a role when quoting the yellow metal.Newswires reveal that Israel began a security meeting to decide its response to Iran and Hezbollah attacks in Tel Aviv.
This week the US economic schedule will feature the New York Empire State Manufacturing Index on Tuesday, followed by the Balance of Trade on Wednesday. Federal Reserve (Fed) members will also be speaking throughout the week.
Daily digest market movers: Gold price traders eye key US economic data
- On Tuesday, according to estimates, the New York Empire State Manufacturing Index for October is expected to fall from 11.3 to 2.3.
- Fed officials, including San Francisco Fed President Mary Daly, Board Governor Adriana Kugler, and Atlanta Fed President Raphael Bostic, are scheduled to make public remarks.
- The combination of a slightly higher Consumer Price Index (CPI) and a weak US employment report on Friday could lead to additional rate cuts by the Fed.
- The yield on the benchmark US 10-year T-note remains above the 4% threshold amid diminishing odds of the Fed's more aggressive policy easing.
- Data from the Chicago Board of Trade, based on the December fed funds rate futures contract, indicates that investors are pricing in 46 basis points (bps) of easing by the Fed toward the end of 2024.
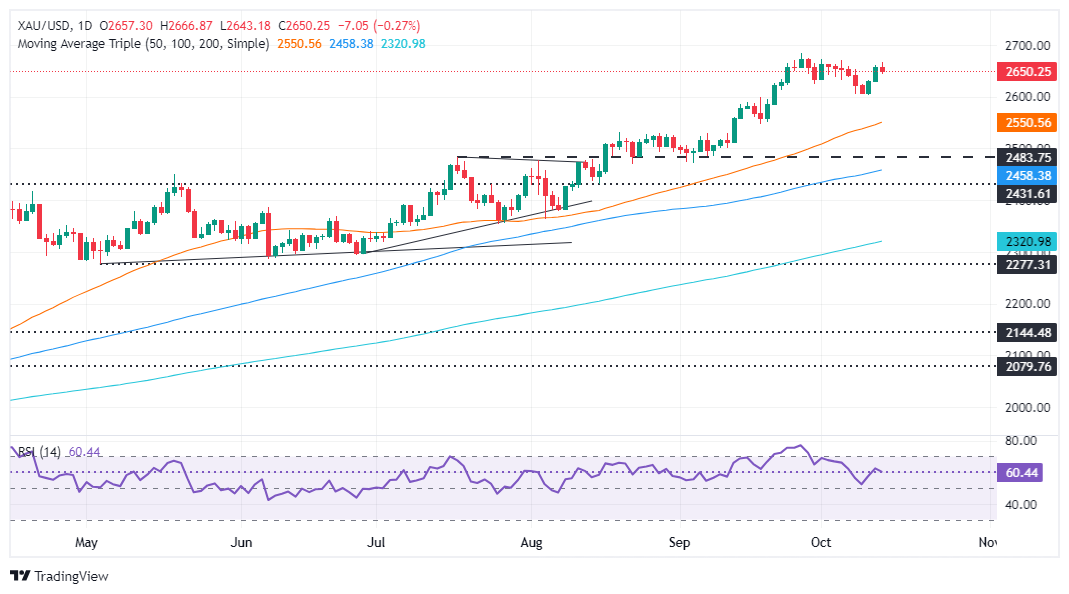
XAU/USD technical outlook: Gold price slumps toward $2,650
Gold price uptrend remains intact despite retreating from around $2,660 toward the $2,650 area. Momentum is bullish, as shown by the Relative Strength Index (RSI), though the RSI edges slightly lower, an indication that some selling pressure remains.
If XAU/USD drops below $2,650, it could pave the way for further downside. The next key support level would be $2,600. A breach of the latter will expose the 50-day Simple Moving Average (SMA) at $2,5550.
Conversely, if XAU/USD clears the October 4 high at $2,670, this could pave the way to challenge the YTD high of $2,685, which is ahead of the $2,700 mark.
Gold FAQs
Gold has played a key role in human’s history as it has been widely used as a store of value and medium of exchange. Currently, apart from its shine and usage for jewelry, the precious metal is widely seen as a safe-haven asset, meaning that it is considered a good investment during turbulent times. Gold is also widely seen as a hedge against inflation and against depreciating currencies as it doesn’t rely on any specific issuer or government.
Central banks are the biggest Gold holders. In their aim to support their currencies in turbulent times, central banks tend to diversify their reserves and buy Gold to improve the perceived strength of the economy and the currency. High Gold reserves can be a source of trust for a country’s solvency. Central banks added 1,136 tonnes of Gold worth around $70 billion to their reserves in 2022, according to data from the World Gold Council. This is the highest yearly purchase since records began. Central banks from emerging economies such as China, India and Turkey are quickly increasing their Gold reserves.
Gold has an inverse correlation with the US Dollar and US Treasuries, which are both major reserve and safe-haven assets. When the Dollar depreciates, Gold tends to rise, enabling investors and central banks to diversify their assets in turbulent times. Gold is also inversely correlated with risk assets. A rally in the stock market tends to weaken Gold price, while sell-offs in riskier markets tend to favor the precious metal.
The price can move due to a wide range of factors. Geopolitical instability or fears of a deep recession can quickly make Gold price escalate due to its safe-haven status. As a yield-less asset, Gold tends to rise with lower interest rates, while higher cost of money usually weighs down on the yellow metal. Still, most moves depend on how the US Dollar (USD) behaves as the asset is priced in dollars (XAU/USD). A strong Dollar tends to keep the price of Gold controlled, whereas a weaker Dollar is likely to push Gold prices up.
Recommended Articles


