


Crude Oil finds floor, but concerns over demand outlook weigh
- Crude Oil rebounds slightly after breaking below $67 on Friday following weaker-than-expected US jobs data.
- Markets see global demand deteriorate further, while the US Federal Reserve isn’t expected to cut interest rates aggressively.
- The US Dollar Index trades above 101.50, extending recent gains.
Crude Oil rebounds slightly on Monday after dipping lower on Friday after the US Jobs Report showed that the US economy is cooling down but not on the edge of a recession, easing the chances of a chunky interest-rate cut by 50 basis points from the US Federal Reserve (Fed) in its upcoming meeting on September 18. This means that there will be no boost in US demand, while other big Oil consumers such as China and India are also experiencing softer economic activity.
The US Dollar Index (DXY), which tracks the performance of the US Dollar (USD) against a basket of currencies, is jumping for the second day in a row. The initial pop occurred on Friday on the back of the US Jobs Report. It looks like markets had clearly depreciated the Greenback too much in the assumption that the Fed would cut rates by 75 or even 100 basis points by November, which isn’t likely to be the case considering the recent healthy US economic data.
At the time of writing, Crude Oil (WTI) trades at $68.05 and Brent Crude at $71.79.
Oil news and market movers: Trafigura paints it black
- Bloomberg reports that major commodity traders Trafigura Group and Gunvor Group Ltd. have painted a bleak picture for Oil, with lingering concerns over Chinese demand and oversupply. Trafigura Group said that OPEC+ is facing a dilemma when it comes to reconciling the group’s goals with what the market needs.
- Morgan Stanley issued another price cut in its forecast for a second time in just a few weeks. Reuters reports that the bank sees Brent Crude at near $75.00 for the fourth quarter.
- Meanwhile, China is trying to consolidate ties with some Oil producing countries, with Chinese Premier Li Qiang set to visit Saudi Arabia and the United Arab Emirates this week, Beijing's foreign ministry said Monday, AFP reports.
- A weather system in the southwestern Gulf of Mexico is forecast to become a hurricane before it reaches the northwestern US Gulf Coast, the US National Hurricane Center said on Sunday, Reuters reports. The area accounts for more than half of the country’s refining capacity.
Oil Technical Analysis: Cold winter for Oil
Time to scroll further down for Oil after leading experts Trafigura Group and Gunvor Group both issued statements saying that more downturn is to come for the fossil fuel. It actually does not need an expert to think that more downturn was unavoidable seeing the US exporting levels at historic highs and Russia unable to sell its crude to China and India without stepping on the toes of its partners within OPEC+. The economic slowdown is only further exposing the issue of oversupply, which might mean more downturn to come.
On the upside, the $75.27 will be the first level to head back to. Next, the $77.43 level aligns with both a descending trendline and the 200-day Simple Moving Average (SMA). In case bulls can break above it, the 100-day SMA at $77.71 could trigger a rejection.
On Friday, the $67.11 key level got broken very briefly. For now, the range between that $67.11 and the $68.00 big figure is to be watched as a hawk in risk for snapping lower again. Next level further down the line is $64.38, the low from March and May 2023.
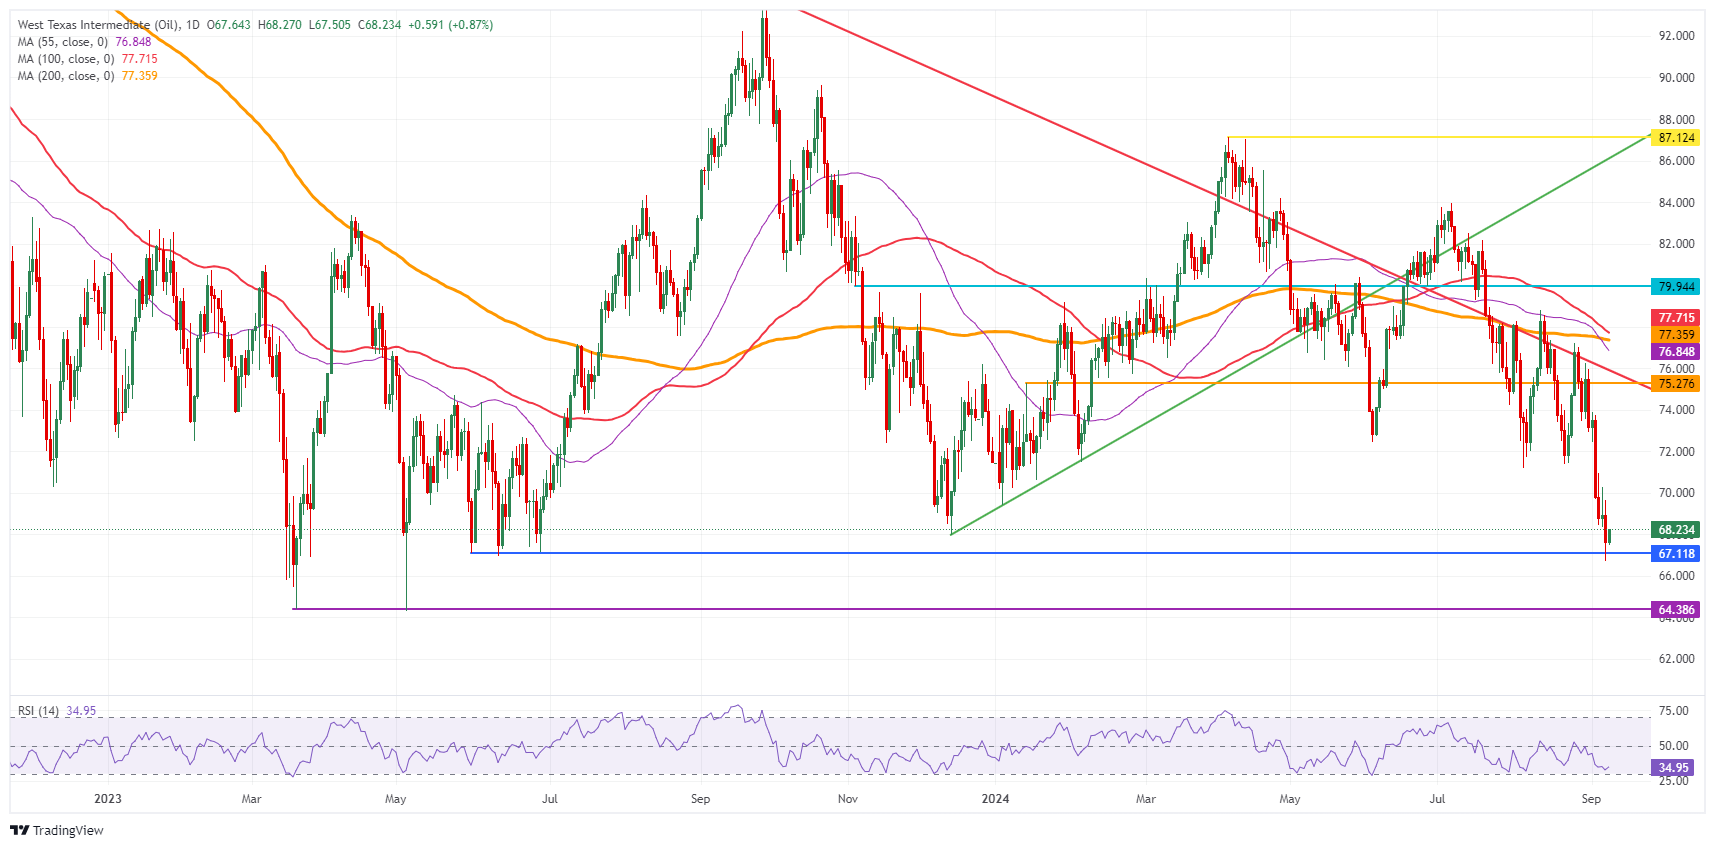
US WTI Crude Oil: Daily Chart
WTI Oil FAQs
WTI Oil is a type of Crude Oil sold on international markets. The WTI stands for West Texas Intermediate, one of three major types including Brent and Dubai Crude. WTI is also referred to as “light” and “sweet” because of its relatively low gravity and sulfur content respectively. It is considered a high quality Oil that is easily refined. It is sourced in the United States and distributed via the Cushing hub, which is considered “The Pipeline Crossroads of the World”. It is a benchmark for the Oil market and WTI price is frequently quoted in the media.
Like all assets, supply and demand are the key drivers of WTI Oil price. As such, global growth can be a driver of increased demand and vice versa for weak global growth. Political instability, wars, and sanctions can disrupt supply and impact prices. The decisions of OPEC, a group of major Oil-producing countries, is another key driver of price. The value of the US Dollar influences the price of WTI Crude Oil, since Oil is predominantly traded in US Dollars, thus a weaker US Dollar can make Oil more affordable and vice versa.
The weekly Oil inventory reports published by the American Petroleum Institute (API) and the Energy Information Agency (EIA) impact the price of WTI Oil. Changes in inventories reflect fluctuating supply and demand. If the data shows a drop in inventories it can indicate increased demand, pushing up Oil price. Higher inventories can reflect increased supply, pushing down prices. API’s report is published every Tuesday and EIA’s the day after. Their results are usually similar, falling within 1% of each other 75% of the time. The EIA data is considered more reliable, since it is a government agency.
OPEC (Organization of the Petroleum Exporting Countries) is a group of 13 Oil-producing nations who collectively decide production quotas for member countries at twice-yearly meetings. Their decisions often impact WTI Oil prices. When OPEC decides to lower quotas, it can tighten supply, pushing up Oil prices. When OPEC increases production, it has the opposite effect. OPEC+ refers to an expanded group that includes ten extra non-OPEC members, the most notable of which is Russia.
Recommended Articles


