


Gold pauses near two-month highs as US-Iran standoff drives Oil prices higher
- Gold loses ground after touching its highest level in two months.
- Rising Oil prices bring inflation concerns back into focus and support Fed rate-hike bets, limiting Gold's recovery.
- XAU/USD holds its bullish bias, with the 100-day SMA acting as immediate resistance.
Gold (XAU/USD) pauses its rally on Tuesday after hitting a two-month high of $4,435 earlier in Asian trading hours. The modest pullback comes as uncertainty over when the Strait of Hormuz will reopen keeps Oil prices elevated. At the time of writing, XAU/USD trades around $4,390, little changed on the day.
Iran says the Strait of Hormuz will not reopen unless Washington pays war reparations and meets several other demands. These include lifting sanctions, releasing frozen Iranian assets, ending military threats and removing the US naval blockade.
US President Donald Trump pushed back with his own demand for compensation from Iran in a post on his Truth Social platform on Monday, saying the US would also seek compensation from Iran for those it had killed and gravely wounded.
In the latest development, Qatar says negotiations between Iran and Oman have reached an advanced stage, adding that it has received positive feedback from both countries. West Texas Intermediate (WTI) trades around $81.30, up over 6% so far this week.
Markets had only briefly scaled back Federal Reserve (Fed) interest rate hike bets following the weaker-than-expected July Nonfarm Payrolls (NFP) report.
However, rising Oil prices are bringing inflation concerns back into focus and tilting market expectations toward a possible rate hike, with the CME FedWatch tool showing a 51.9% chance of an increase at the September meeting.
Geopolitical tensions, along with hawkish Fed expectations, are keeping the US Dollar (USD) supported near its recent lows, while US Treasury yields also remain elevated. This, in turn, creates a difficult backdrop for Gold to stage a stronger recovery.
Traders may wait for the US Consumer Price Index (CPI) data on Wednesday for fresh direction. In the meantime, US-Iran headlines are likely to drive short-term price action.
According to TD Securities, a "modest, but not overly concerning, rebound in July CPI this week will not be enough to push the Fed towards hikes," with "a good portion of the strength in the report" likely coming from "the reversal of one-off weakness in June." The bank’s forecast of "0.20% for core CPI" is expected to "keep the Fed looking to August inflation data ahead of the September meeting," while TD also highlights that "PPI on Thursday will also be a key input into PCE estimates."
Technical analysis: Bulls struggle near 100-day SMA
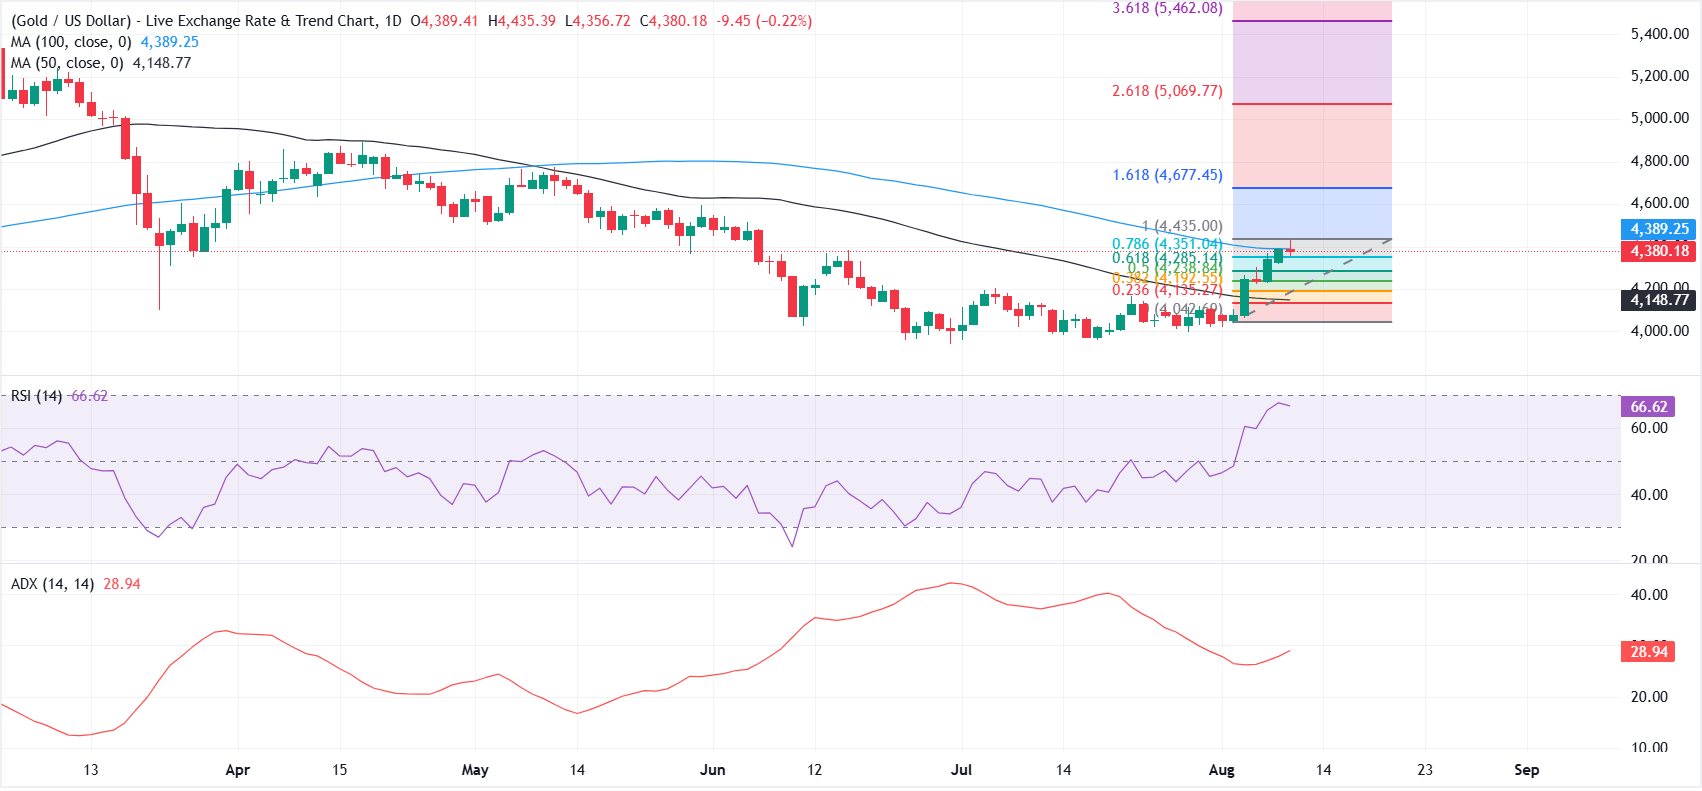
On the daily chart, Gold retains a bullish near-term bias as XAU/USD holds comfortably above the 50-day Simple Moving Average (SMA) at $4,148 and key Fibonacci retracement supports, while pressing into overhead supply defined by the 100-day SMA at $4,389.
The Relative Strength Index (RSI) near 66 leans toward overbought territory, and the Average Directional Index (ADX) just below 30 hints at a still-directional but moderating trend, suggesting upside momentum remains constructive but increasingly vulnerable to consolidation near the current highs.
On the topside, immediate resistance is at the 100-day SMA at $4,389, followed by the cycle high and the 100% Fibonacci retracement at $4,435, where a clear break would open the way for a fresh extension of the bullish leg.
On the downside, initial support is seen at the 78.6% retracement at $4,351, with deeper pullbacks likely to find buying interest at the 61.8% level at $4,285 and the 50% retracement at $4,238, while the 50-day SMA at $4,148 marks a more meaningful structural floor that would need to give way to ease current bullish sentiment.
(The technical analysis of this story was written with the help of an AI tool. Know more.)
Gold FAQs
Gold has played a key role in human’s history as it has been widely used as a store of value and medium of exchange. Currently, apart from its shine and usage for jewelry, the precious metal is widely seen as a safe-haven asset, meaning that it is considered a good investment during turbulent times. Gold is also widely seen as a hedge against inflation and against depreciating currencies as it doesn’t rely on any specific issuer or government.
Central banks are the biggest Gold holders. In their aim to support their currencies in turbulent times, central banks tend to diversify their reserves and buy Gold to improve the perceived strength of the economy and the currency. High Gold reserves can be a source of trust for a country’s solvency. Central banks added 1,136 tonnes of Gold worth around $70 billion to their reserves in 2022, according to data from the World Gold Council. This is the highest yearly purchase since records began. Central banks from emerging economies such as China, India and Turkey are quickly increasing their Gold reserves.
Gold has an inverse correlation with the US Dollar and US Treasuries, which are both major reserve and safe-haven assets. When the Dollar depreciates, Gold tends to rise, enabling investors and central banks to diversify their assets in turbulent times. Gold is also inversely correlated with risk assets. A rally in the stock market tends to weaken Gold price, while sell-offs in riskier markets tend to favor the precious metal.
The price can move due to a wide range of factors. Geopolitical instability or fears of a deep recession can quickly make Gold price escalate due to its safe-haven status. As a yield-less asset, Gold tends to rise with lower interest rates, while higher cost of money usually weighs down on the yellow metal. Still, most moves depend on how the US Dollar (USD) behaves as the asset is priced in dollars (XAU/USD). A strong Dollar tends to keep the price of Gold controlled, whereas a weaker Dollar is likely to push Gold prices up.
Recommended Articles


