


Crude Oil Price Forecast: Middle East Tensions Push Up Oil Prices, Can They Still Rise After Breaking $100?
TradingKey - Affected by the continuous escalation of geopolitical tensions in the Middle East, Brent crude ( UKOIL) broke back above the psychological $100-per-barrel threshold after two months, as market concerns over global oil supply security rapidly intensified.
Meanwhile, expanding energy transportation risks, tightening refining supply, and renewed tensions between the U.S. and Iran have also prompted investors to reassess the future trajectory of oil prices.
Why Crude Oil Prices Are Rising?
The surge in oil prices primarily stems from a triple supply shock triggered by tensions in the Middle East: Houthi attacks on Saudi oil tankers, the escalation of the US-Iran conflict, and attacks on Russian refining facilities.
Yemen's Houthi militants issued a statement on the 23rd, claiming that in response to what they called a Saudi-imposed blockade on Yemen and to implement their operational principle of "responding to a blockade with a blockade," they had launched military strikes against two Saudi oil tankers.
According to Saudi sources, the Saudi Arabian oil tanker "Enselia" was attacked while sailing in the Red Sea, which caused a fire at the bow, though all crew members are safe. The Houthi threat has had a material impact on the market, with at least five Saudi-linked tankers turning back after the Houthi blockade threat escalated, while three other tankers turned off their Automatic Identification Systems (AIS).
As some tankers rerouted and others suspended transit or turned off their AIS vessel identification systems, market concerns grew that another critical global oil transit route could face prolonged disruption, following the Strait of Hormuz.
Due to mounting shipping pressure in the Strait of Hormuz in recent years, an increasing volume of crude oil from Gulf nations such as Saudi Arabia needs to be shipped to Asian and European markets via the Red Sea route. If shipping efficiency in the Bab-el-Mandeb Strait declines, not only will transit times and costs rise, but the global crude supply chain will also tighten further, causing oil prices to quickly price in a new risk premium.
Meanwhile, the US-Iran military standoff continues to escalate. US President Donald Trump publicly stated that he is "close" to deciding to launch a major attack on Iran, sharply heightening market fears of a full-scale conflict.
In an exclusive interview, Trump said he is considering launching an "unprecedented" major attack, and that the US military is "fully prepared." Iran countered in a tit-for-tat response, warning that if the US carries out these strikes, Iran will retaliate against US-linked infrastructure and energy assets throughout the entire region.
In addition to the situation in the Middle East, ongoing drone strikes on Russia's refining system have placed further pressure on the global supply of refined oil products.
In recent years, frequent strikes on multiple Russian refining facilities have impacted the production of refined products such as diesel. The International Energy Agency (IEA) previously cautioned that global refining capacity is recovering at a slower pace than crude supply, and inventories of products like diesel and gasoline remain low. This means that even if crude supply has not yet decreased significantly, the refined product market could still experience tightness, thereby providing further support to international oil prices.
Will Crude Oil Prices Continue to Rise?
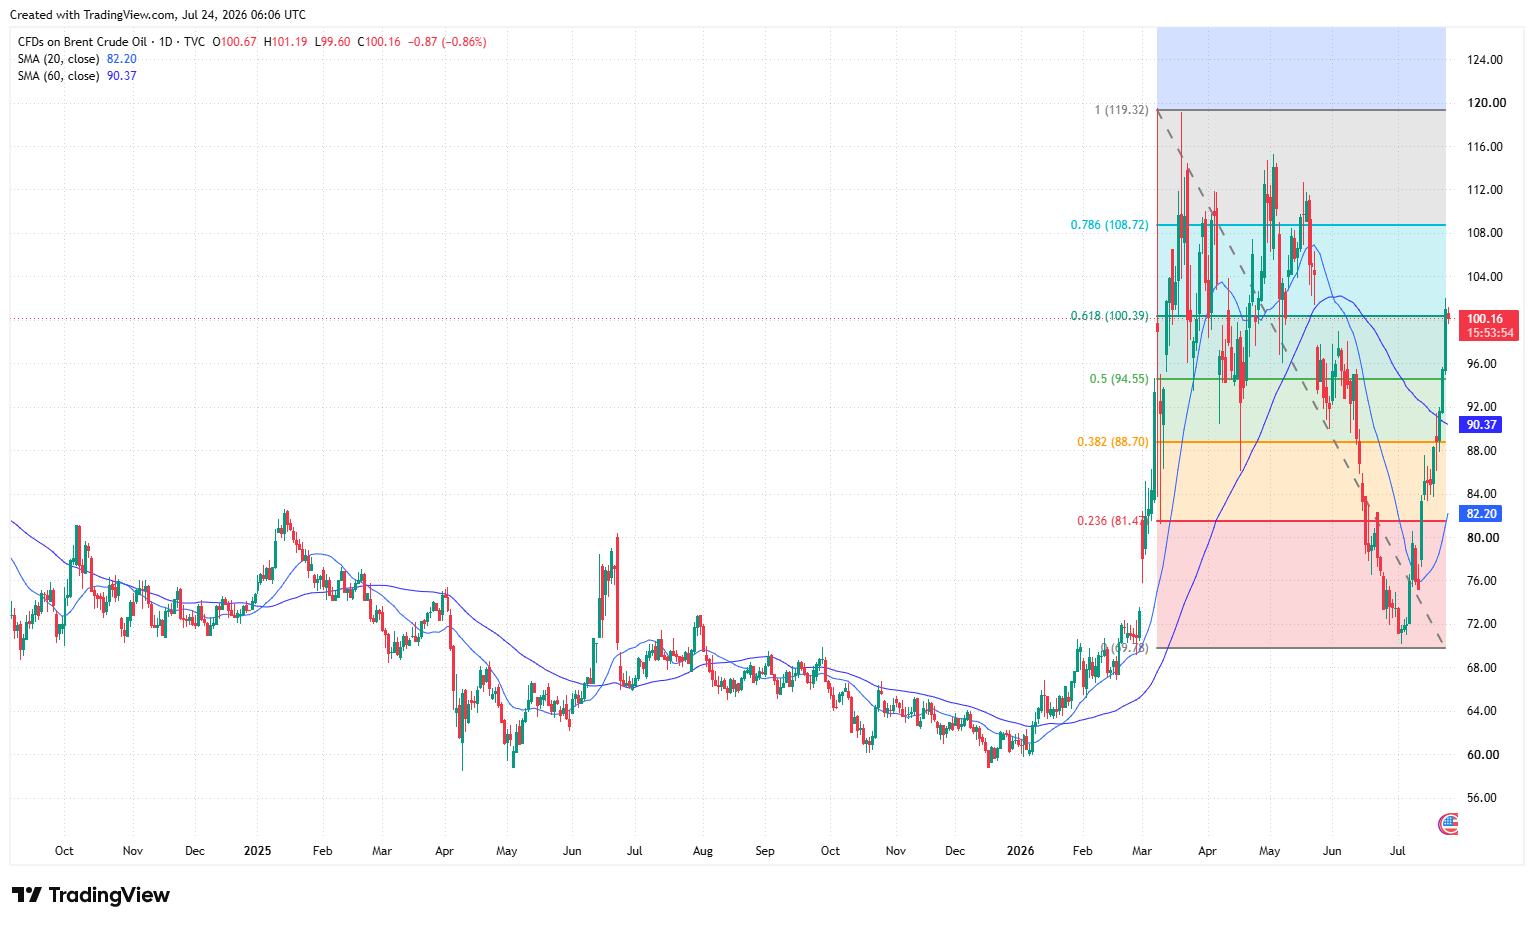
Brent Crude oil price daily chart, Source: TradingView
From the daily chart, Brent crude rebounded rapidly after testing around $70 in early July, successively reclaiming three Fibonacci retracement levels at $81.47, $88.70, and $94.55, and climbing back above the 20-day and 60-day moving averages. This indicates that the short-term trend has turned from bearish to bullish. The downward trendline previously connecting the high of $119.32 has also been broken, reflecting that market selling pressure has significantly eased, and the geopolitical risk premium is being priced back into oil prices.
Oil prices are currently trading at $100.16, hovering right around the 61.8% Fibonacci retracement level of $100.39. This position is the most critical technical resistance for the current rebound, as well as the key to determining whether oil prices can open up further upside. The latest daily candlestick receded slightly after hitting a high of $101.19, indicating that strong profit-taking and selling pressure from trapped positions still exist in the $100–$101.20 zone. Since the current daily session has not yet closed, it is too early to confirm whether oil prices have decisively broken above $100.
If Brent crude can establish a foothold above $100.39 on a daily closing basis, preferably breaking further above $101.20 and holding the $100 level during a subsequent pullback, the current rally is expected to extend. On the upside, the primary focus will be on the short-term resistance at $104–$105; a breakout there would point toward the 78.6% Fibonacci retracement level at $108.72. If the Middle East situation continues to escalate and widens the supply risk premium, oil prices could further challenge $112–$115, or even retest the previous high of $119.32.
However, there is still a hidden risk in the current moving average structure. Although oil prices have climbed above the 20-day moving average of $2.20 and the 60-day moving average of $90.37, the 20-day moving average remains below the 60-day moving average, indicating that the medium-term moving averages have not yet formed a formal bullish alignment. Given the rapid pace of this rally, the divergence between the price and the short-term moving averages has widened significantly. Therefore, even though the overall trend is strong, investors should guard against a potential pullback from highs or a technical retest near $100.
On the downside, initial support can be watched around $96, with further support at $94.55. As long as any correction holds above $94.55, the breakout structure of this run remains intact, and there remains a possibility of another charge toward $100 after consolidation. If the daily chart falls back below $94.55, the upward momentum will significantly weaken, and oil prices may pull back to test the 60-day moving average at $90.37 as well as the support at $88.70. Once $88.70 is also lost, the bullish short-term reversal logic will be invalidated.
Recommended Articles


