


Why Gold Is Starting to Trade Like a Tech Stock: How Systematic Capital Is Reshaping Gold Prices
For decades, the analytical framework for gold was relatively straightforward. Macro investors typically focused on real interest rates, the U.S. dollar, inflation expectations, central-bank purchases, and geopolitical risk. These variables determine gold’s long-term value and form the foundation of traditional gold research.
In recent years, however, a growing number of investors have found that these macro variables alone are increasingly insufficient to explain gold’s short-term price action.
The same increase in rate-cut expectations may produce a sustained rally on one occasion and a sharp reversal on another. The same escalation in geopolitical conflict may send gold rapidly higher in one episode, yet in another create the seemingly paradoxical situation in which the news becomes more bullish while the price becomes less responsive. Gold can even experience violent multi-day swings when the fundamental backdrop has barely changed.
These patterns do not mean that the macro framework has stopped working. They indicate that the marginal price setter in the gold market has changed.
Historically, gold prices were driven mainly by long-horizon capital such as central banks, exchange-traded funds, macro funds, and physical demand. Today, a growing share of marginal trading comes from systematic capital. Commodity Trading Advisors, risk-parity funds, volatility-targeting strategies, and options market makers have become important participants in gold’s short-term price formation.
These investors are not primarily asking what gold is worth. They are continuously adjusting positions according to trend, volatility, and risk constraints.
Understanding gold today therefore requires both macro analysis and an understanding of how systematic capital trades.
Gold Now Has Two Pricing Systems Operating at the Same Time
Gold’s long-term direction is still determined by macroeconomic forces.
Real interest rates, confidence in the U.S. dollar, fiscal deficits, central-bank purchases, changes in the international reserve system, and inflation expectations evolve slowly. They determine whether gold has long-term allocation value and shape the broad direction of its price.
But the way gold rises from day to day—when it accelerates, when it pauses, and when it corrects—is increasingly influenced by a second set of variables.
Price trends, volatility, systematic positioning, risk budgets, liquidity, and options hedging change continuously. They do not alter gold’s long-term value, but they do alter the behavior of marginal capital.
This is the most important change in the modern gold market: slow-moving variables determine direction, while fast-moving variables determine the path.
Consider a geopolitical conflict that sends gold sharply higher, only for the price to retreat a few hours later. The war has not ended. Central banks have not sold their gold. The long-term investment thesis has not changed.
What has changed may not be the market’s view, but its risk capacity.
Suppose a CTA model still identifies gold as being in an uptrend, but gold volatility rises from 10% to 20%. To maintain a fixed level of portfolio risk, the strategy may be forced to reduce its position.
This produces a pattern that has become increasingly common: the directional signal remains bullish, but the position size is already falling.
That is one of the biggest differences between today’s gold market and the market of the past.
Historically, price was largely the result of macro information. Today, price itself increasingly influences the next round of trading behavior.
Price changes trigger position adjustments, and those position adjustments feed back into price. When more capital follows similar rules, the market develops a self-reinforcing feedback mechanism.
This is why gold is beginning to trade more like a technology stock.
Why Gold Is Starting to Trade Like a Tech Stock
Gold is not becoming more like technology stocks because their fundamentals are converging. It is becoming more like them because, during strong-trend regimes, price is increasingly shaped by the interaction of trend following, systematic capital, and options hedging. The short-term price-formation mechanism therefore begins to display similar characteristics.
In the past, a gold rally generally required new macro information. Today, the rise in price can itself become a new trading signal.
Once gold breaks through a key level, trend models begin to build positions. Momentum capital, options-related flows, and leveraged investors then join the move. The resulting buying pushes the price higher, and the higher price further strengthens the trend signal.
A move that was initially triggered by macro fundamentals can therefore evolve into a relay race among systematic investors.
Fundamentals are the ignition. Positioning and hedging are the accelerant.
During a strong trend, gold does not need a fresh macro catalyst every day. Often, yesterday’s rally becomes today’s new reason to buy.
What is increasingly tech-like is not gold’s underlying asset identity, but its trading structure.
These feedback loops, however, cannot continue indefinitely.
How far a trend can extend depends not only on whether the price continues to rise, but also on whether systematic investors can continue to carry the associated risk.
The variable that ultimately determines that capacity is not the price level itself, but volatility. In simple terms, volatility describes the intensity of price fluctuations. Markets generally distinguish between two forms. Realized volatility, or RV, is calculated from past price movements and reflects volatility that has already occurred. Implied volatility, or IV, is derived from option prices and represents the market’s expectation of future volatility.
Why Volatility Changes the Price Path
For many systematic strategies, price determines whether to trade, while volatility determines how much to trade.
When a trend strengthens, some investors increase exposure in the direction of the move. When volatility rises, other investors reduce risk. At the same time, dynamic hedging in the options market, changes in margin requirements, and market liquidity can amplify the existing trend.
In the modern gold market, price changes do not merely reflect fundamentals. They also create additional price changes through the position adjustments of systematic investors.
Macro variables determine why a move begins. Systematic capital determines how the move evolves.
Systematic capital is not a single, homogeneous group. Different strategies focus on different variables and follow different trading and position-sizing rules.
This article focuses on CTAs, risk-parity funds, and volatility-targeting strategies. Together, these groups represent three of the most important systematic frameworks: trend, risk allocation, and volatility management. They also provide the clearest illustration of how systematic position adjustments can influence the gold price.
Once these three mechanisms are understood, the core architecture of systematic trading in the modern gold market becomes much easier to understand.
We begin with CTAs.
CTA: Is There a Trend?
Under the regulatory definition, a Commodity Trading Advisor, or CTA, is an individual or institution that provides clients with advice or account-management services involving futures, options, foreign exchange, or swaps. A CTA is therefore not, strictly speaking, a fund. In market practice, however, funds and managed accounts run by CTAs—often trading systematically through futures and other derivatives—are commonly referred to as “CTA strategies” or “CTA funds.”
These strategies typically operate across gold, crude oil, equity indices, government bonds, and foreign exchange. A significant share of the industry uses cross-asset trend-following models, but CTAs are not synonymous with trend following, and not every CTA relies exclusively on quantitative trend signals.
The defining feature of many CTA strategies is that they do not attempt to forecast the price. They follow the trend. They generally do not ask whether gold is overvalued or whether a war will escalate. Instead, they use price behavior and market risk to determine whether to buy, sell, and how much exposure to hold.
Different CTAs use different models, lookback windows, and risk targets. Most trend-following CTAs, however, can be summarized in three steps: identify direction, assess trend strength, and size the position according to risk.
Step One: Identify the Direction of the Trend
The first question for a CTA is not why gold is rising, but whether a trend has already formed.
Different models use different methods. They may examine whether the price is above a long-term moving average, whether a short-term moving average is above a long-term moving average, or whether returns over the past one, three, six, and twelve months have remained positive. Once a model concludes that an uptrend has formed, it gradually establishes a long position. If the trend weakens, it reduces exposure and may eventually turn short.
Step Two: Assess the Strength of the Trend
Not every rally deserves a large position.
Suppose gold rises 10% over three months, but does so through large daily swings. That move carries substantial risk. If gold rises by the same 10% through a much smoother path, the model will generally regard the second trend as being of higher quality.
CTAs therefore look not only at return, but also at realized volatility when assessing the reliability of a trend. The more stable the trend, the stronger the signal the model will typically assign.
Step Three: Adjust the Position for Risk
The ultimate determinant of CTA position size is not the trend itself, but the risk budget.
Suppose a CTA fund wants gold to contribute 10% annualized risk. When forecast volatility is low, the model can hold a relatively large position. If forecast volatility doubles, the model must reduce its exposure to maintain the same risk contribution.
In many cases, the model remains bullish but is forced to cut the position because gold volatility has risen. This is why gold can remain in an uptrend even as CTA exposure begins to decline.
Not all CTAs adjust at the same time. Although they follow broadly similar logic, their models are not identical. One of the most important differences is response speed, which is often linked to the lookback window used to generate the trend signal.
Illustrative CTA Models by Trend-Response Speed
Note: This table illustrates typical characteristics and is not an industry-standard classification. Institutions may define “fast” and “slow” according to signal lookback, model response speed, holding period, or trading frequency.
Model Type | Typical Observation Window | Typical Market Response |
Fast CTA | Several weeks to one month | First to establish positions and first to exit |
Medium-Speed CTA | Three to six months | Adds exposure gradually after the trend is confirmed |
Slow CTA | Six to twelve months or longer | Last to enter and last to exit |
A gold rally therefore rarely attracts all CTAs at the same time. Entry tends to proceed from fast to slow. Fast CTAs are usually the first to establish positions after a breakout. If the trend persists, medium- and long-horizon CTAs follow. Long exposure accumulates, and the trend becomes progressively stronger.
The same sequence operates in reverse when gold begins to fall. Short-horizon CTAs are generally the first to reduce exposure. If the decline continues, medium- and long-horizon models exit in turn. If gold volatility rises at the same time, risk-control models require an additional reduction in exposure.
The market can then face two sources of selling simultaneously: weaker trend signals and tighter risk controls. When the two forces reinforce each other, an ordinary correction can become a much faster and more violent decline.
This is why CTAs are often described as pro-trend investors. They are not usually the origin of a trend, but once a trend has formed, their continued buying or selling can amplify the move.
CTAs primarily adjust positions according to trend and volatility. A second major pool of long-horizon capital—risk parity—focuses instead on the balance of risk across assets. Both frameworks use volatility to control risk, but their trading logic is fundamentally different.
Risk Parity: Is Risk Balanced?
Risk parity is not a category of fund dedicated to gold. It is a multi-asset allocation framework that typically invests across equities, bonds, gold, and other commodities. Its objective is not to allocate an equal amount of capital to each asset, but to make the assets contribute roughly comparable amounts of portfolio risk.
Risk parity is therefore concerned less with how capital is allocated than with how risk is allocated. A traditional 60/40 portfolio diversifies dollars between equities and bonds, but because equity volatility is usually much higher than bond volatility, most of the portfolio’s actual risk still comes from equities. Traditional allocation focuses on capital weights. Risk parity focuses on each asset’s contribution to total portfolio risk.
Risk-parity models generally pay particular attention to the following variables.
Model Input | Why It Matters |
Asset volatility | Determines how much risk an individual asset contributes |
Cross-asset correlation | Determines whether diversification is effective |
Risk contribution | Determines whether the portfolio needs to be rebalanced |
This is also why gold can play an important role in a risk-parity portfolio. Gold’s own volatility is not low, but its correlation with equities and bonds is often low or even negative. When equities perform poorly, gold can sometimes provide a different source of return and thereby reduce total portfolio volatility. Risk parity allocates to gold not because gold is always the safest asset, but because gold can improve the portfolio’s overall risk structure.
Risk parity, however, does not keep adding gold simply because the price rises. For these strategies, a rally is not enough. The more important question is whether gold’s contribution to total portfolio risk has risen above target.
If gold continues to appreciate while its volatility also rises, its contribution to portfolio risk may increase rapidly even if the fund still regards gold as strategically attractive. To restore the intended risk balance, the model will generally reduce gold exposure and reallocate risk to other assets.
This creates an apparent contradiction. A fundamental investor may see a rising gold price and conclude that the position should be maintained. A risk-parity model may see that gold is now carrying too much of the portfolio’s risk and conclude that exposure should be reduced through rebalancing.
Correlation matters as much as volatility. If gold continues to rise when equities fall, or if it maintains a low or negative correlation with equities, it can still provide valuable diversification even when its own volatility is high.
But during a liquidity shock, gold, equities, and bonds may all fall together. Correlations rise, and gold’s diversification value weakens. Even if gold’s fundamentals have not changed, a risk-parity model may reduce the allocation further.
Assessing whether risk parity is likely to sell gold therefore requires more than observing the gold price. Investors must also examine gold volatility, its correlation with other assets, and its contribution to total portfolio risk.
Volatility Targeting: Is There Still Capacity to Add Leverage?
Volatility-targeting strategies are another class of quantitative investor. Their key distinction from CTAs is that CTAs determine direction, while volatility-targeting strategies determine position size.
CTAs ask whether a trend has formed. Volatility-targeting funds ask a different question: given current market risk, how much risk should the total portfolio carry?
These strategies generally set a fixed volatility target. When markets are calm and forecast volatility is low, the model can increase leverage and expand positions. When markets become turbulent and forecast volatility rises sharply, the model must reduce leverage and shrink exposure to bring portfolio risk back within the target range.
The principle is simple: the lower the forecast volatility, the larger the position the strategy can hold; the higher the forecast volatility, the smaller the position must become.
Suppose a fund targets 10% portfolio volatility. If forecast volatility is only 5%, it can carry approximately two times the baseline risk exposure. If forecast volatility rises to 20%, the model must reduce exposure to approximately 0.5 times the baseline level to maintain the same risk target.
During a rally, this can create a procyclical feedback loop. The calmer the market, the lower the forecast volatility, and the more exposure the model can add. The additional buying may further stabilize the market, pushing volatility even lower and allowing the model to increase exposure again.
The sequence becomes: low volatility → more exposure → a more stable market → even lower volatility.
When the market suddenly weakens, the process can reverse: high volatility → position reduction → greater market pressure → even higher volatility.
This feedback loop is not always present, and its strength depends on the market environment.
Importantly, this behavior does not mean the fund is bullish or bearish on gold. It is the automatic result of a risk-control rule. Gold may be sold not because its long-term thesis has changed, but because it has become too volatile relative to the strategy’s risk budget.
Many volatility-targeting strategies adjust the total portfolio rather than gold in isolation.
If a sharp equity sell-off causes forecast portfolio volatility to surge, a fund may sell equities, bonds, commodities, and gold simultaneously even when there is no negative news about gold itself.
This is one reason almost all assets can fall together during the early phase of a financial crisis.
At that point, the market is not competing for future return. It is competing for cash, margin, and balance-sheet capacity. Because gold is liquid and easy to sell, it may become one of the first assets to be liquidated.
Gold’s behavior during a crisis can therefore be divided into three stages.
Stage one: the risk event erupts, and safe-haven demand pushes gold higher.
Stage two: the market enters a phase of deleveraging and liquidity contraction, and gold is sold because it is a highly liquid asset.
Stage three: as liquidity is restored, real interest rates fall, or concerns about monetary credibility intensify, gold generally strengthens again.
A decline in gold during a crisis therefore does not mean its safe-haven function has failed. It means that, in the short term, the market needs cash more urgently. Once liquidity pressure eases, gold’s safe-haven characteristics often reassert themselves.
The Four-Quadrant Quantitative Framework for Gold
The preceding sections examined the trading logic of CTAs, risk-parity funds, volatility-targeting strategies, and options-related hedging. In real markets, however, these forces do not operate independently. They are all influenced by two core variables: trend and volatility.
Looking at trend or volatility in isolation is not enough to identify the market’s true state. A more practical approach is to place trend strength and volatility level within a single four-quadrant framework. This makes it possible to assess how different types of capital are likely to adjust positions and which phase the market is most likely to enter next.
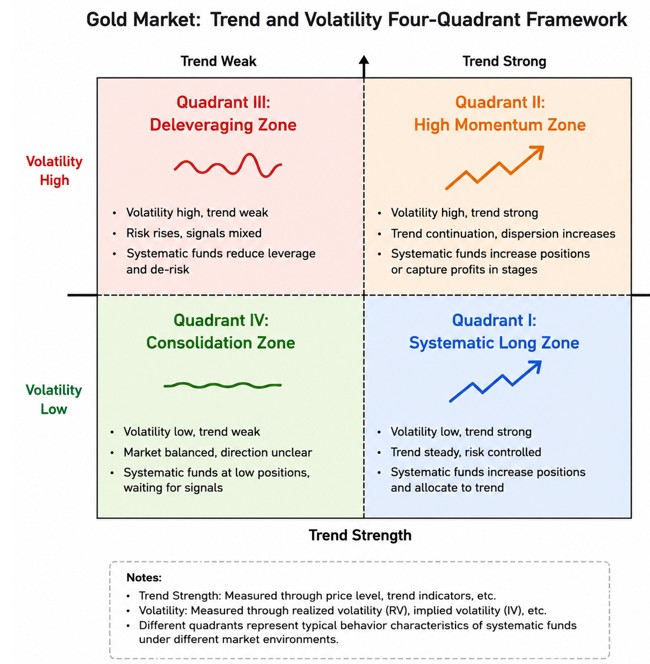
The central value of the framework is that the same rise or fall in the gold price can produce entirely different investor behavior and market risk depending on the quadrant.
Quadrant I: Strong Trend, Low Volatility — The Systematic Long Zone
This is the regime in which systematic investors are most likely to align on the long side.
CTAs have clear long signals. Risk-parity strategies do not yet need to rebalance aggressively because gold’s risk contribution is not excessive. Volatility-targeting funds can maintain or even increase exposure. The price may not rise dramatically every day, but the advance is steady, drawdowns are shallow, and volatility remains manageable. These conditions make it easier for trend-following capital to continue entering the market.
Systematic investors do not simply see that gold has already risen substantially. They see that the trend can still be carried within the available risk budget.
The greatest risk in this quadrant is not an immediate trend reversal, but an acceleration in price that drives volatility sharply higher and pushes the market into Quadrant II.
Quadrant II: Strong Trend, High Volatility — The High-Level Contest
This is the regime investors are most likely to misread.
The gold trend remains positive. Fundamentals may continue to improve, and sentiment may be highly optimistic. Yet systematic behavior is already beginning to change. CTAs retain bullish signals but may reduce positions because volatility has risen. Risk-parity funds begin to rebalance. Volatility-targeting funds reduce total risk exposure. Options market-maker hedging can further amplify short-term swings.
This is the state in which direction remains bullish while position size declines.
Gold can therefore stop rising even as bullish news continues to accumulate. This does not necessarily mean the market doubts the news. It may mean that the speed of the price increase has exceeded the speed at which risk budgets can expand.
The central question in Quadrant II is whether new discretionary buying can absorb the mechanical selling generated by systematic strategies. If it can, the trend may continue. If it cannot, the market can form an interim top at precisely the moment when fundamentals appear strongest and sentiment is most euphoric.
Quadrant III: Weak Trend, High Volatility — The Deleveraging Zone
This is the most dangerous of the four regimes.
The trend is deteriorating while volatility remains elevated, causing multiple systematic groups to move to the sell side at the same time. CTAs reduce long exposure or turn short as trend signals weaken. Volatility-targeting funds continue cutting exposure to control risk. Risk-parity portfolios rebalance. Options market-maker hedging and the forced liquidation of leveraged positions add further selling pressure.
The essence of a deleveraging move is not that everyone believes gold should fall. It is that too many investors are required to sell at the same time.
Deleveraging is also a process of market cleansing. Once crowded positions have been reduced and volatility peaks and begins to fall, the market often moves into the next phase: Quadrant IV.
Quadrant IV: Weak Trend, Low Volatility — The Accumulation Zone
This is the calmest regime, but it is also the regime most capable of incubating a new trend.
CTA positioning is generally low. Risk-parity funds remain close to their strategic allocation. As volatility declines, volatility-targeting funds gradually rebuild risk capacity. The market may lack a clear direction, but systematic investors are effectively accumulating the capacity to participate in the next move.
The key question is not whether the immediate move will be up or down. It is how much new systematic capital will be triggered once the price breaks out.
If gold breaks higher, CTAs, breakout strategies, and options hedging can reinforce the move. If it breaks lower, the same mechanisms can operate in reverse. Direction is uncertain in Quadrant IV, but once a valid breakout occurs, the potential adjustment in systematic positions is often substantial enough to help create a new trend.
The four quadrants are not separate and isolated market states. They form a path through which capital continuously migrates.
The most common evolution in the gold market is:
Quadrant IV: low-volatility accumulation → Quadrant I: a stable trend after the breakout → Quadrant II: price acceleration and rising volatility → Quadrant III: trend breakdown and systematic deleveraging → a decline in volatility and a return to Quadrant IV.
This framework is therefore more informative than a simple bull-market or bear-market label.
A bull market can still enter Quadrant II, where risk is accumulating rapidly. A late-stage bear market can begin to create new opportunities as it transitions from Quadrant III to Quadrant IV. The important question is not merely whether the market is bullish or bearish, but which stage systematic capital is entering.
Mapping Major Systematic Strategies onto the Four Quadrants
Market State | CTA | Risk Parity | Volatility Targeting |
Strong trend, low volatility | Increase long exposure | Mild rebalancing | Increase risk capacity |
Strong trend, high volatility | Remain bullish but cut position size | Reduce excessive risk contribution | Begin deleveraging |
Weak trend, high volatility | Exit longs or turn short | Reduce allocation | Continue reducing exposure |
Weak trend, low volatility | Maintain low positioning | Remain near strategic weight | Risk capacity recovers |
The same sell order can reflect very different motivations. A CTA may sell because the trend has weakened, or simply because volatility has risen and the position must be scaled down. Risk parity may sell because gold’s risk contribution has exceeded its target. A volatility-targeting fund may sell because total portfolio risk has increased. A market maker may sell only to complete a hedge.
Although all of these transactions appear as selling in the market, their duration and stopping conditions are different. The critical analytical question is therefore not simply who is selling, but why they are selling and what would cause them to stop.
Only by identifying the source of the selling can an investor determine whether the current pullback is an ordinary portfolio rebalance or the beginning of a broader systematic deleveraging cycle. This is the principal value of the four-quadrant framework: it focuses not only on the price, but on how different types of capital change their behavior across market environments.
Conclusion: Gold Has Not Changed—the Marginal Price Setter Has
Gold’s long-term pricing logic has not changed. Real interest rates, confidence in the U.S. dollar, fiscal risk, central-bank reserves, and geopolitics remain the central determinants of its long-term value. The participation of quantitative investors does not invalidate these macro drivers.
What has changed is the process through which the gold price is formed.
In the modern gold market, long-horizon investors determine whether gold deserves a strategic allocation. CTAs determine whether a trend deserves to be followed. Risk-parity strategies determine whether gold is carrying too much portfolio risk. Volatility-targeting funds determine how much risk exposure the market can sustain. Options market makers can amplify existing price moves through dynamic hedging.
These investors do not share the same objectives, but they can still execute similar trades at the same time. Important turning points therefore often occur not because fundamentals suddenly change, but because different types of systematic capital begin adjusting positions simultaneously.
This explains an apparently contradictory pattern that often appears in gold. The long-term thesis may remain intact. The macro narrative may remain constructive. Investors may remain broadly bullish. Yet the price begins to lose momentum or enters a visible correction. The explanation is not necessarily that the market has rejected gold. It may be that the marginal price setter has changed.
The four-quadrant quantitative framework introduced in this article is designed to answer that question. It asks not only whether gold is rising or falling, but which capital regime the market is currently in and how different systematic strategies are likely to shape the next stage of price evolution.
A typical investor asks: “Why is gold rising?” A macro analyst goes further: “Do real rates, the dollar, fiscal conditions, and central-bank demand support gold?” Systematic investors ask a different set of questions: “Is the trend strong enough? Is volatility rising? Can the risk budget continue to expand?”
The first set of questions determines gold’s long-term direction. The second determines its trading path.
Only by combining macro fundamentals with market microstructure can investors fully understand today’s gold market. Gold remains an ancient monetary asset, but a growing share of its short-term price fluctuations is now being shaped by the architecture of modern quantitative trading.
Recommended Articles


