

Gold slips as hot US PPI lifts US yields and US Dollar
- US producer prices surge, reinforcing higher-for-longer Fed rate expectations.
- Gold is pressured by US Treasury yields and a rise in the US Dollar.
- Iran war inflation risks keep markets defensive ahead of US data.
Gold (XAU/USD) price edges lower during Wednesday’s session following another high inflation print in the US: input prices for producers, which hit their highest level in four years. At the time of writing, the XAU/USD pair trades at $4,699, down some 0.30%.
XAU/USD weakens as sticky inflation dampens Fed cut hopes
The market is in a risk-off mood for two consecutive days amid spiking US inflation due to the US-Iran war. In the meantime, US President Donald Trump arrived in Beijing for the US-China summit.
The chances for a peace deal are shrinking, while Trump stated that Iran would be decimated if they don’t sign a deal. Tehran’s demands include lifting sanctions, unfreezing funds, reparations for war damage, and sovereignty over the Strait of Hormuz.
On Tuesday, Trump added that he doesn’t need China’s help to end the conflict.
Recently, the US Producer Price Index (PPI) rose sharply in April by 6% YoY, exceeding March’s 4.3% rise. Excluding volatile items, the so-called Core PPI increased by 5.2% YoY, up from March’s 4%, above forecasts of 4.3%. A day ago, consumer inflation rose 3.8% YoY, the highest since 2023.
Consequently, US Treasury yields jumped, with the 10-year yield up 2.5 basis points to 4.488%. The US Dollar Index (DXY), which measures the Greenback against six major currencies, rose 0.21% to 98.49.
Money markets do not expect adjustments to the Fed funds rate, as data from Prime Terminal suggests the Fed will keep rates unchanged throughout 2026.
Fed implied forward rates
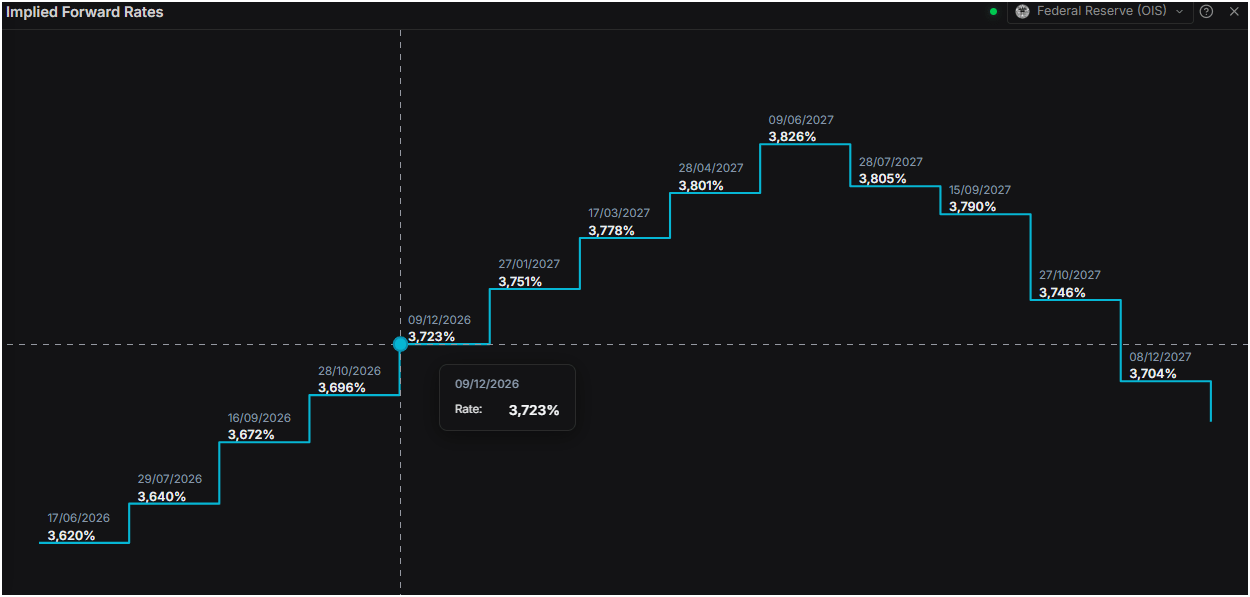
In the meantime, Boston Fed Susan Collins said that rate hikes would be needed if inflation fails to get towards the central bank’s 2% goal. She added that she expects to keep the restrictive policy. At the same time, Minneapolis Fed Neel Kashkari, a voter in 2026, said that inflation is running too high due to the Iran war and that the labor market looks better.
Ahead in the week, the US economic schedule will feature Initial Jobless Claims for the week ending May 9, Retail Sales data, and speeches by Fed officials Schmid, Hammack, Williams, and Barr.
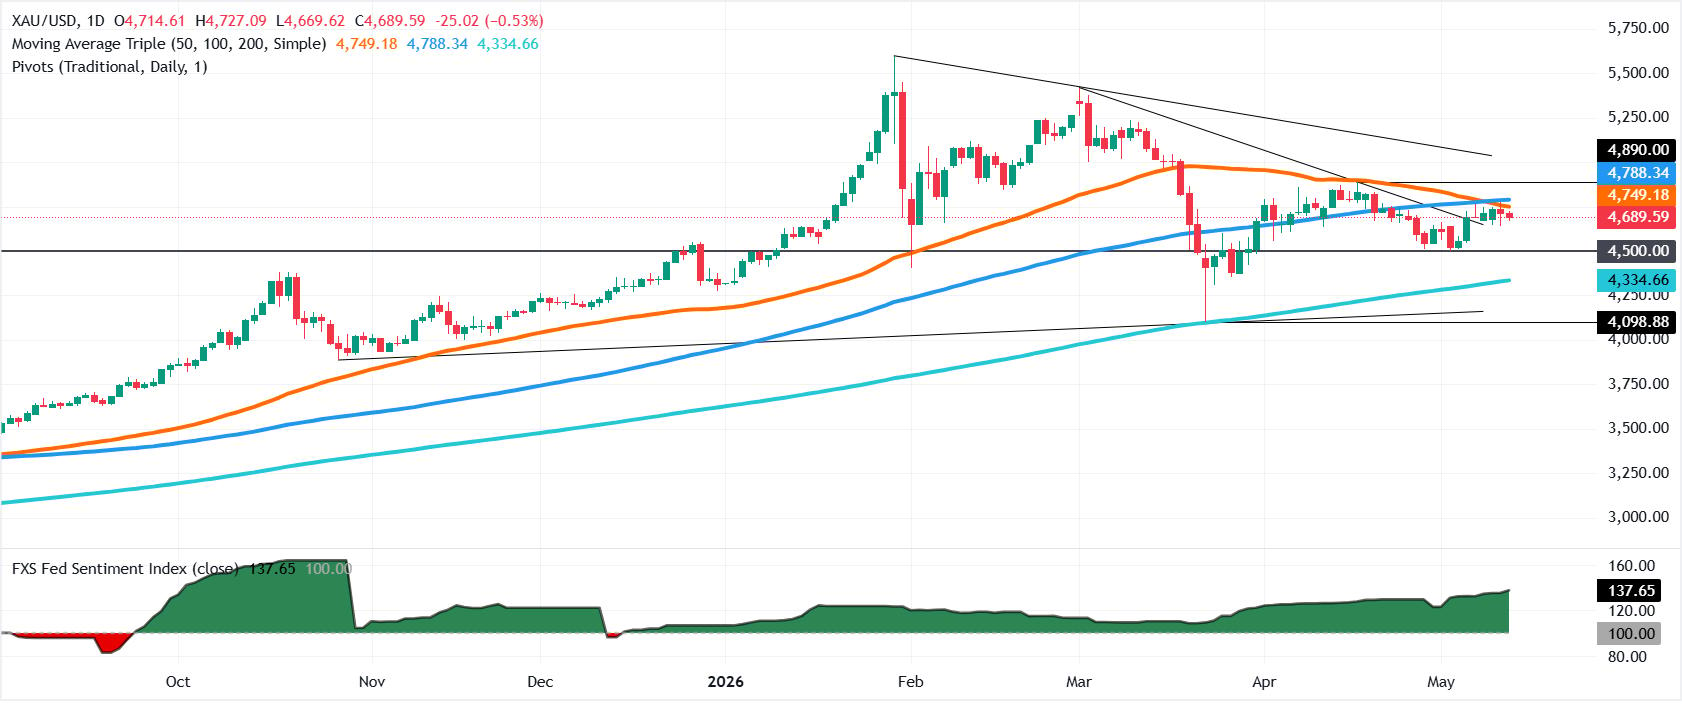
XAU/USD technical outlook: Gold’s advance capped at $4,700 as bears lurk
Gold price is struggling to clear $4,700, as key resistance levels lie overhead, with the 50- and 100-day Simple Moving Averages (SMAs) at $4,749 and $4,780, respectively. Price action is contained within the $4,650 - $4,700 area, but US economic data has remained solid, opening the door for further downside.
Momentum tilted bearish as the Relative Strength Index (RSI) slipped below the 50 neutral level.
With that said, Gold’s first seen at the 20-day SMA near $4,683, followed by the $4,600 level. Below that, the next key area is May 4 swing low around $4,500.
Upwards, initial resistance sits at $4,700. A break above it would bring the 50-day SMA at $4,749 into view; beyond that, bulls could aim for the 100-day SMA near $4,780 and then the $4,800 figure.
Gold FAQs
Gold has played a key role in human’s history as it has been widely used as a store of value and medium of exchange. Currently, apart from its shine and usage for jewelry, the precious metal is widely seen as a safe-haven asset, meaning that it is considered a good investment during turbulent times. Gold is also widely seen as a hedge against inflation and against depreciating currencies as it doesn’t rely on any specific issuer or government.
Central banks are the biggest Gold holders. In their aim to support their currencies in turbulent times, central banks tend to diversify their reserves and buy Gold to improve the perceived strength of the economy and the currency. High Gold reserves can be a source of trust for a country’s solvency. Central banks added 1,136 tonnes of Gold worth around $70 billion to their reserves in 2022, according to data from the World Gold Council. This is the highest yearly purchase since records began. Central banks from emerging economies such as China, India and Turkey are quickly increasing their Gold reserves.
Gold has an inverse correlation with the US Dollar and US Treasuries, which are both major reserve and safe-haven assets. When the Dollar depreciates, Gold tends to rise, enabling investors and central banks to diversify their assets in turbulent times. Gold is also inversely correlated with risk assets. A rally in the stock market tends to weaken Gold price, while sell-offs in riskier markets tend to favor the precious metal.
The price can move due to a wide range of factors. Geopolitical instability or fears of a deep recession can quickly make Gold price escalate due to its safe-haven status. As a yield-less asset, Gold tends to rise with lower interest rates, while higher cost of money usually weighs down on the yellow metal. Still, most moves depend on how the US Dollar (USD) behaves as the asset is priced in dollars (XAU/USD). A strong Dollar tends to keep the price of Gold controlled, whereas a weaker Dollar is likely to push Gold prices up.
Recommended Articles


