


Gold price edges up despite strong US manufacturing data
- Gold price experiences slight gains in a market bolstered by positive US manufacturing activity reports.
- Surge in US Treasury yields following optimistic ISM and S&P Global reports challenges the appeal of non-yielding Gold.
- A stronger US Dollar Index curtails Gold's upward trajectory as market participants trim their bets on Fed rate cuts.
Gold price climbed on Monday, but it remained below the all-time high of $2,265. The bright metal is losing some momentum, yet it remains up 0.30% on the day. At the time of writing, XAU/USD exchanges hands at $2,240 after hitting a daily low of $2,228.
Business activity in the United States (US) picked up in March, according to the Institute for Supply Management’s (ISM) Manufacturing Purchasing Managers Index (PMI) and to S&P Global. The former exceeded estimates and crushed February’s data, while the latter cooled but stood in expansionary territory. This data along with a robust economic outlook in the US could dent the Federal Reserve (Fed) from cutting interest rates.
The ISM Manufacturing PMI expanded for the first time since September 2022. That pushed US Treasury bond yields higher, a headwind for the non-yielding metal. Investors were prompted to take profits in the yellow metal in exchange for US treasuries, which tend to be more appealing amid expectations for higher interest rates.
The US Dollar Index (DXY), which measures the American currency’s value against six others, stood at 104.99 and gained 0.44%, limiting the XAU/USD advance.
Daily digest market movers: Gold stays afloat but off all-time highs
- On Friday, Fed Chair Jerome Powell responded to the latest inflation data, stating it aligned with their expectations and indicating that the Fed would not overreact to these figures. This suggests that the US central bank would remain in a wait-and-see approach toward future monetary policy decisions.
- Following Friday’s report of the Fed’s preferred inflation gauge, the Personal Consumption Expenditures (PCE), a softer reading, sent Gold prices rallying sharply, though it retreated on Powell’s words.
- The ISM Manufacturing PMI expanded by 50.3, above estimates of 48.4, crushing February’s 47.8 reading. The Prices Paid Index increased by 55.8, its highest level since August 2022, when it hit 52.5.
- S&P Global revealed the latest revision of March’s Manufacturing PMI for the United States, which came in at 51.9, up from the previous reading of 52.2.
- After the data release, market participants diminished their bets for a 25-basis-point rate cut in June to 58% from above 60% last Friday.
Technical analysis: Gold rally appears overextended but is set to continue
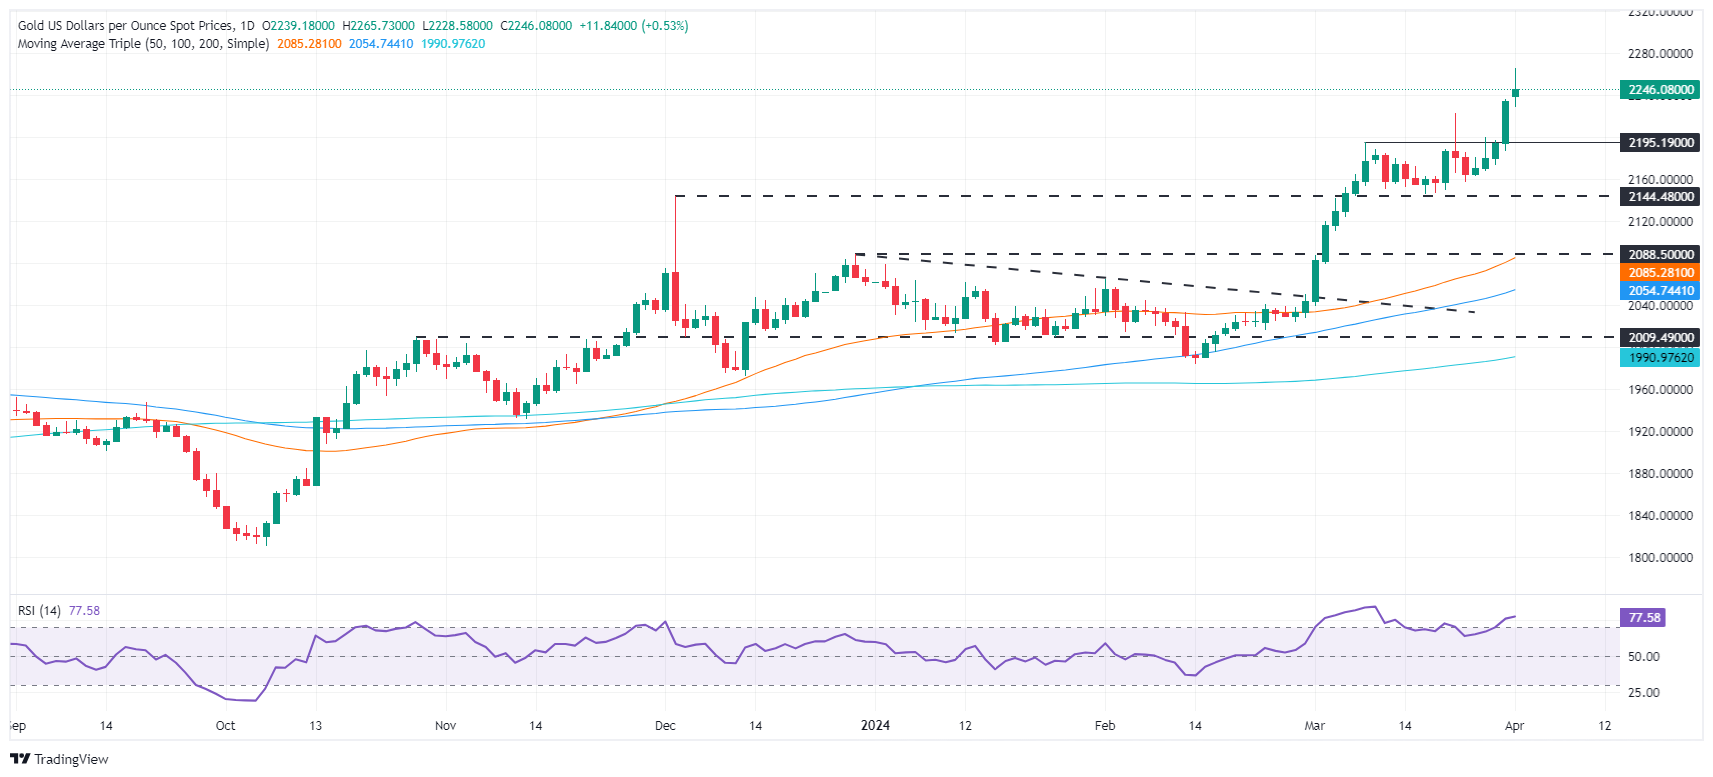
The XAU/USD daily chart depicts Gold's last uptick to new all-time highs, achieved on lower momentum, as depicted by the Relative Strength Index (RSI). As Gold reached the ATH, the RSI stood at 77.21, below its highest level reached on March 11 at 84.41, suggesting a negative divergence is forming.
Nevertheless, the scenario of a mean reversion move is riskier. Still, a break below $2,200 could sponsor a pullback toward the March 8 high turned support at $2,195, ahead of extending its losses to $2,150.
Look for a break above $2,270 for a bullish resumption, which would expose $2,300.
Gold FAQs
Gold has played a key role in human’s history as it has been widely used as a store of value and medium of exchange. Currently, apart from its shine and usage for jewelry, the precious metal is widely seen as a safe-haven asset, meaning that it is considered a good investment during turbulent times. Gold is also widely seen as a hedge against inflation and against depreciating currencies as it doesn’t rely on any specific issuer or government.
Central banks are the biggest Gold holders. In their aim to support their currencies in turbulent times, central banks tend to diversify their reserves and buy Gold to improve the perceived strength of the economy and the currency. High Gold reserves can be a source of trust for a country’s solvency. Central banks added 1,136 tonnes of Gold worth around $70 billion to their reserves in 2022, according to data from the World Gold Council. This is the highest yearly purchase since records began. Central banks from emerging economies such as China, India and Turkey are quickly increasing their Gold reserves.
Gold has an inverse correlation with the US Dollar and US Treasuries, which are both major reserve and safe-haven assets. When the Dollar depreciates, Gold tends to rise, enabling investors and central banks to diversify their assets in turbulent times. Gold is also inversely correlated with risk assets. A rally in the stock market tends to weaken Gold price, while sell-offs in riskier markets tend to favor the precious metal.
The price can move due to a wide range of factors. Geopolitical instability or fears of a deep recession can quickly make Gold price escalate due to its safe-haven status. As a yield-less asset, Gold tends to rise with lower interest rates, while higher cost of money usually weighs down on the yellow metal. Still, most moves depend on how the US Dollar (USD) behaves as the asset is priced in dollars (XAU/USD). A strong Dollar tends to keep the price of Gold controlled, whereas a weaker Dollar is likely to push Gold prices up.
Recommended Articles


