

USD/JPY Price Forecast: Downtrend resumes boosted by falling US yields
- USD/JPY downtrend continues, as downward momentum accelerates after volatility from US Nonfarm Payrolls data.
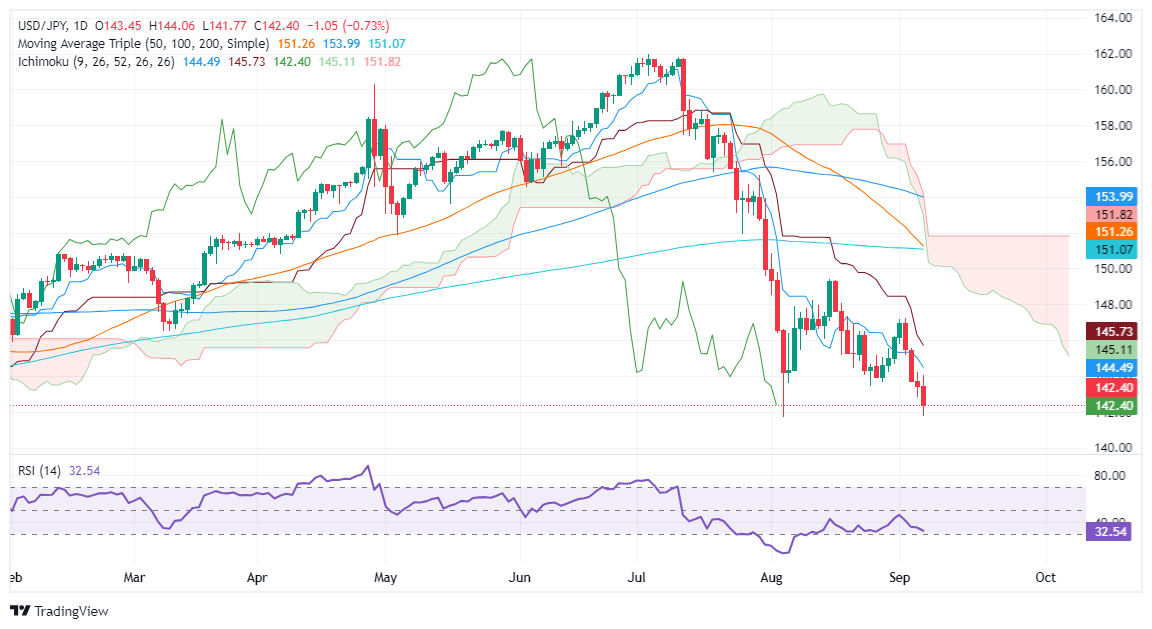
- Key support levels include 142.50, 142.00, and today’s low of 141.77, with further downside likely if these are breached.
- Resistance stands at 143.44, with higher targets at 144.49 (Tenkan-Sen) and 145.00 (Senkou Span A) if bulls regain control.
The USD/JPY extended its losses late on Friday's North American session, bolstered by the losses of the yield of the US 10-year T-note. The Greenback recovered some ground against most G8 FX currencies, except safe-haven currencies like the Japanese Yen. At the time of writing, the pair trades at
USD/JPY Price Forecast: Technical outlook
The USD/JPY downtrend continued after the latest US Nonfarm Payrolls report sparked volatility in the pair, which seesawed within a 230-pip range on the day, but as the dust settled, sellers remained in charge.
Momentum had accelerated to the downside, confirmed by the Relative Strength Index (RSI) aiming lower, an indication of a strong trend.
The USD/JPY's first support would be the psychological level of 142.50. Once surpassed, the next stop would be the 142.00 mark, followed by today’s low of 141.77. Once those two levels are cleared, the drop could extend toward the August 5 low of 141.69.
On the other hand, the first resistance would be the August 26 daily low of 143.44. A breach of the latter would expose key resistance levels. First, the Tenkan-Sen will be at 144.49, followed by the Senkou Span A at 145.00. Up next would be the Kijun-Sen at 145.73.
USD/JPY Price Action – Daily Chart
Japanese Yen FAQs
The Japanese Yen (JPY) is one of the world’s most traded currencies. Its value is broadly determined by the performance of the Japanese economy, but more specifically by the Bank of Japan’s policy, the differential between Japanese and US bond yields, or risk sentiment among traders, among other factors.
One of the Bank of Japan’s mandates is currency control, so its moves are key for the Yen. The BoJ has directly intervened in currency markets sometimes, generally to lower the value of the Yen, although it refrains from doing it often due to political concerns of its main trading partners. The current BoJ ultra-loose monetary policy, based on massive stimulus to the economy, has caused the Yen to depreciate against its main currency peers. This process has exacerbated more recently due to an increasing policy divergence between the Bank of Japan and other main central banks, which have opted to increase interest rates sharply to fight decades-high levels of inflation.
The BoJ’s stance of sticking to ultra-loose monetary policy has led to a widening policy divergence with other central banks, particularly with the US Federal Reserve. This supports a widening of the differential between the 10-year US and Japanese bonds, which favors the US Dollar against the Japanese Yen.
The Japanese Yen is often seen as a safe-haven investment. This means that in times of market stress, investors are more likely to put their money in the Japanese currency due to its supposed reliability and stability. Turbulent times are likely to strengthen the Yen’s value against other currencies seen as more risky to invest in.
Recommended Articles


