NZD/JPY Price Forecast: Cross extends recovery, three-day winning streak

Source Fxstreet
  • NZD/JPY consolidates sideways as technical indicators show mixed signals.
  • The RSI is near the oversold terrain but rising, while the MACD shows decreasing red bars.
  • Volume has been decreasing, indicating that selling pressure may be easing.

The NZD/JPY pair traded sideways on Thursday, consolidating above the 88.00 level. The pair has been in a downtrend since early August, but it has found some support at the 88.00 level. The Relative Strength Index (RSI) is currently at 31, which is slightly oversold. The Moving Average Convergence Divergence (MACD) is also showing signs of a potential reversal, with decreasing red bars. Additionally, the pair's volume has been decreasing in recent sessions, which could indicate that the selling pressure is easing.

NZD/JPY daily chart

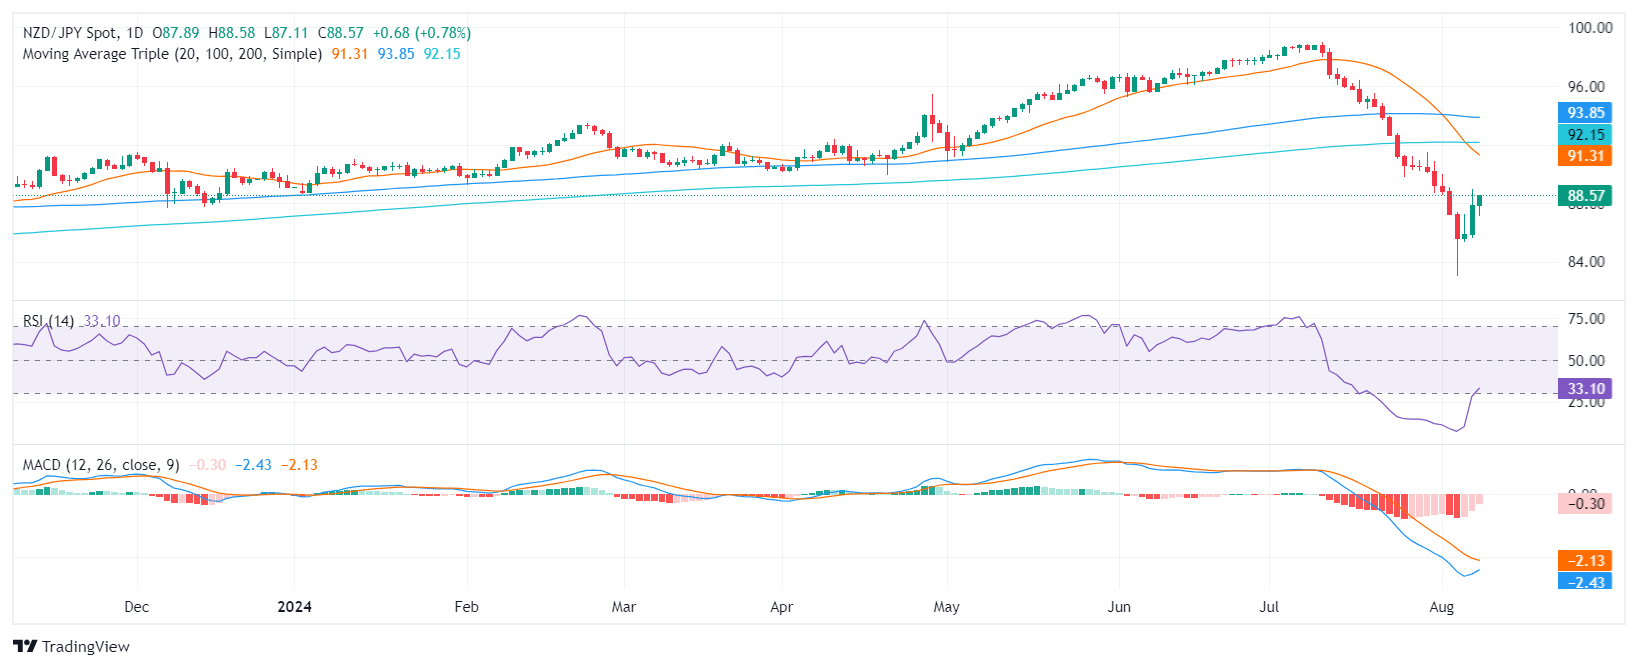
The NZD/JPY pair is consolidating above the 87.00 level, and the bulls are attempting to push the pair towards the 90.00 zone. If the bulls are successful, it could open the door to further gains towards the 91.00 zone. However, if the bears manage to push the pair below the 87.00 level, it could lead to a deeper correction.


Disclaimer: For information purposes only. Past performance is not indicative of future results.
placeholder
New Fed Chair to Cut Forward Guidance? Warsh Rejects Dot-Plot Expectations, Bullish or Bearish for Bitcoin? If Warsh rejects dot plot projections, it could suppress institutional capital and weaken market risk appetite in the short term, but is a long-term positive for Bitcoin.On June 17, Asian
Author  TradingKey
12 hours ago
If Warsh rejects dot plot projections, it could suppress institutional capital and weaken market risk appetite in the short term, but is a long-term positive for Bitcoin.On June 17, Asian
placeholder
Three Major International Investment Banks Bearish on Oil Outlook, Citi Expects Brent to Fall to $70. Crude Oil Prices Fall for Four Straight Days to Levels at Start of US-Iraq War.On June 16, after US President Donald Trump sent consecutive signals of geopolitical easing, the two major crude oil benchmarks extended their recent declines and are poised to return to
Author  TradingKey
20 hours ago
On June 16, after US President Donald Trump sent consecutive signals of geopolitical easing, the two major crude oil benchmarks extended their recent declines and are poised to return to
placeholder
Japanese Yen hangs near intervention zone despite BoJ rate hike, ahead of FOMCThe USD/JPY pair ticks lower during the Asian session on Wednesday, though it remains within striking distance of the highest level since late April, touched last week.
Author  FXStreet
20 hours ago
The USD/JPY pair ticks lower during the Asian session on Wednesday, though it remains within striking distance of the highest level since late April, touched last week.
placeholder
Has Gold Hit Bottom? Barclays, Citi Both Bullish on Gold, Gold Price Will Return to $5,000 Next Year.Since 2026, gold has erased almost all of its gains and has fallen more than 20% from its record high of $5,595 set at the end of January. Has gold bottomed out? Is now the time to add to
Author  TradingKey
Yesterday 10: 30
Since 2026, gold has erased almost all of its gains and has fallen more than 20% from its record high of $5,595 set at the end of January. Has gold bottomed out? Is now the time to add to
placeholder
WTI hovers around $80.00 as traders await developments on US-Iran peace talksWest Texas Intermediate (WTI) oil price inches higher after registering 3.7% losses in the previous day, trading around $80.10 per barrel during the Asian hours on Tuesday.
Author  FXStreet
Yesterday 01: 19
West Texas Intermediate (WTI) oil price inches higher after registering 3.7% losses in the previous day, trading around $80.10 per barrel during the Asian hours on Tuesday.
Related Instrument
goTop
quote