


Mexican Peso sinks to seven-week low as economy stagnates in Q2
- Mexican Peso slumps to weekly low of 18.81 as disappointing GDP data sparks USD buying.
- Mexican Q2 GDP growth at 0.2% QoQ, below estimates of 0.4%, trails Q1's 0.3%.
- Economic slowdown increases odds of Bank of Mexico rate cut; next meeting on August 8.
The Mexican Peso extended its agony and printed losses of more than 0.80% against the Greenback after the preliminary release of the Gross Domestic Product (GDP) for Q2 2024. It was slightly below estimates and trailed the first quarter reading. Hence, traders bought the US Dollar as seen by the USD/MXN trading at 18.79, refreshing seven-week highs after bouncing off daily lows of 18.41.
Mexico’s Instituto Nacional de Estadística Geografia e Informatica, known as INEGI by its Spanish acronym, revealed that GDP rose 0.2% QoQ, below estimates of 0.4% and trailing Q1’s 0.3% increase. Although the economy achieved 11 quarters of expansion, growth has decelerated, raising the chances of an interest rate cut by the Bank of Mexico (Banxico).
Banxico lifted rates as high as 11.25% but cut them to 11.00% in March, laying the ground for additional adjustments. However, the latest inflation data refrained the central bank’s Governing Council from easing policy.
The Mexican central bank's next meeting is on August 8, and economists cited by Reuters noted that GDP data could influence policymakers to lower borrowing costs.
Andres Abadia of Pantheon Macroeconomics said, “Real GDP growth has slowed rapidly in recent quarters, which will add to the view that Banxico will have to cut interest rates gradually over upcoming policy meetings.”
A solid US JOLTS report also influenced the USD/MXN in the United States (US) as job openings dropped yet exceeded estimates, and an upward revision to May figures showed the labor market's resilience.
Daily digest market movers: Mexican Peso is heavy as the economy slows down
- Mexico’s GDP for Q2 2024 grew 2.2% YoY on its preliminary reading, above estimates of 2% and the previous quarter's 1.6% expansion.
- Last week, Mexico’s June Balance of Trade was $-1.073 billion, missing the consensus of $1 billion.
- US Job Openings and Labor Turnover Survey (JOLTs) came at 8.184 million, exceeding estimates of 8 million, but were lower than May’s revision up to 8.23 million.
- Conference Board revealed that Consumer Confidence in July surprisingly rose to 100.3, exceeding the 99.7 consensus and June’s downward revision from 100.4 to 97.8.
- Data by the Chicago Board of Trade (CBOT) shows that traders are pricing 54 basis points (bps) of easing toward the end of the year, as shown by the December 2024 fed funds rate futures contract.
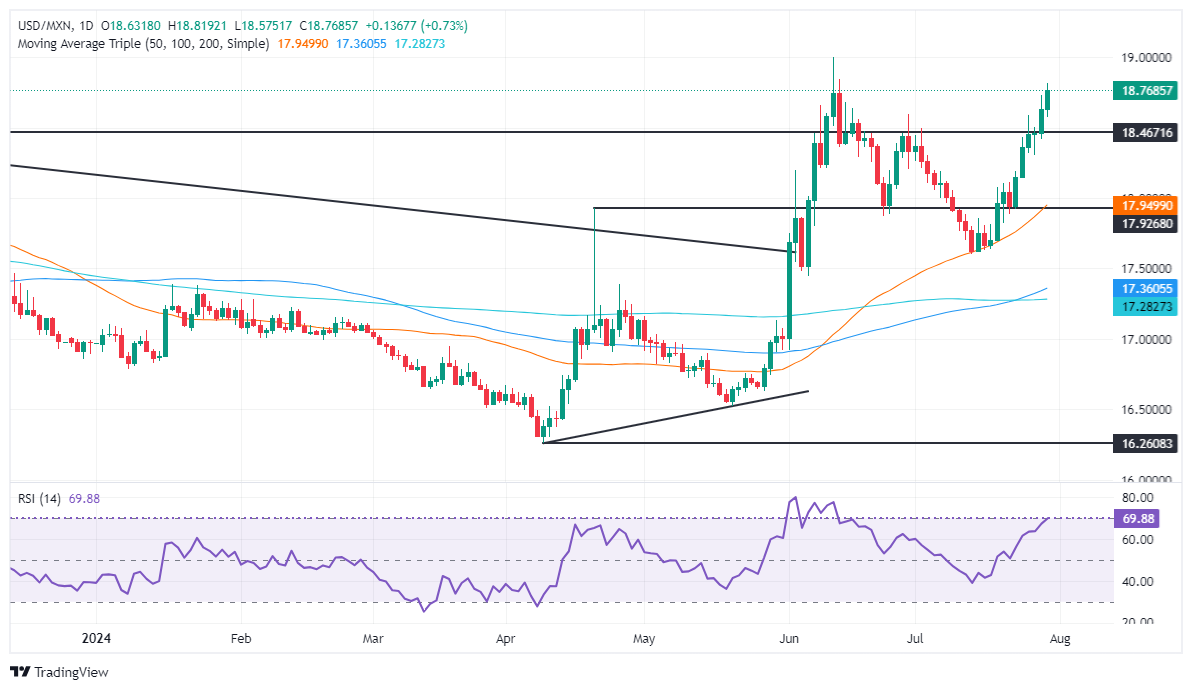
Technical analysis: Mexican Peso dives as USD/MXN rises toward 18.80
The USD/MXN exotic pair is set to test the year-to-date (YTD) high of 18.99 after refreshing multi-week highs of 18.81. Momentum as depicted by the Relative Strength Index (RSI) supports buyers, with the RSI approaching overbought conditions.
If USD/MXN surpasses the YTD high at 18.99, that could open the door to test 19.00. Once surpassed, the next resistance would be March 20, 2023, peaking at 19.23 before challenging 19.50.
Conversely, if USD/MXN retreats below 18.00, it would pave the way to challenge the 50-day Simple Moving Average (SMA) at 17.93, the first support level. The next support would be the latest cycle low of 17.58, the July 12 high turned support. A breach of this level will expose the January 23 peak at 17.38.
Mexican Peso FAQs
The Mexican Peso (MXN) is the most traded currency among its Latin American peers. Its value is broadly determined by the performance of the Mexican economy, the country’s central bank’s policy, the amount of foreign investment in the country and even the levels of remittances sent by Mexicans who live abroad, particularly in the United States. Geopolitical trends can also move MXN: for example, the process of nearshoring – or the decision by some firms to relocate manufacturing capacity and supply chains closer to their home countries – is also seen as a catalyst for the Mexican currency as the country is considered a key manufacturing hub in the American continent. Another catalyst for MXN is Oil prices as Mexico is a key exporter of the commodity.
The main objective of Mexico’s central bank, also known as Banxico, is to maintain inflation at low and stable levels (at or close to its target of 3%, the midpoint in a tolerance band of between 2% and 4%). To this end, the bank sets an appropriate level of interest rates. When inflation is too high, Banxico will attempt to tame it by raising interest rates, making it more expensive for households and businesses to borrow money, thus cooling demand and the overall economy. Higher interest rates are generally positive for the Mexican Peso (MXN) as they lead to higher yields, making the country a more attractive place for investors. On the contrary, lower interest rates tend to weaken MXN.
Macroeconomic data releases are key to assess the state of the economy and can have an impact on the Mexican Peso (MXN) valuation. A strong Mexican economy, based on high economic growth, low unemployment and high confidence is good for MXN. Not only does it attract more foreign investment but it may encourage the Bank of Mexico (Banxico) to increase interest rates, particularly if this strength comes together with elevated inflation. However, if economic data is weak, MXN is likely to depreciate.
As an emerging-market currency, the Mexican Peso (MXN) tends to strive during risk-on periods, or when investors perceive that broader market risks are low and thus are eager to engage with investments that carry a higher risk. Conversely, MXN tends to weaken at times of market turbulence or economic uncertainty as investors tend to sell higher-risk assets and flee to the more-stable safe havens.
Recommended Articles


