


USD/CAD Price Forecast: RSI near 66 signals strong buying interest
- USD/CAD holds near a one-month high as diverging Fed-BoC rate expectations weigh on the Canadian Dollar.
- USD/CAD remains bullish above the 50-day and 100-day SMAs, with the RSI near 66 signaling strong buying momentum.
- The pair faces immediate resistance at 1.4300, while 1.4200 offers initial support.
USD/CAD is little changed on Thursday, holding near a one-month high. A broadly stronger US Dollar (USD) and diverging interest rate expectations for the Federal Reserve (Fed) and the Bank of Canada (BoC) keep the Canadian Dollar (CAD) on the back foot. At the time of writing, USD/CAD trades around 1.4245, down 0.04% on the day.
USD strength seen pressuring Canadian Dollar as BoC hike odds fade
According to TD Securities, the US Dollar still has scope to advance against selected majors, with analysts noting that “across global major currencies, we see room for the USD to rally selectively against CAD and KRW in the near-term.” They argue that “diverging employment data releases will likely keep USDCAD supported above 1.40,” as Canada’s labour market softens relative to the US. In particular, TD highlights that a “rising unemployment rate amid falling wage growth rate in Canada also reduces the market pricing of a December BoC rate hike relative to the Fed,” reinforcing their view that the Canadian Dollar will remain under pressure against the Dollar in the near term.
Technical Analysis
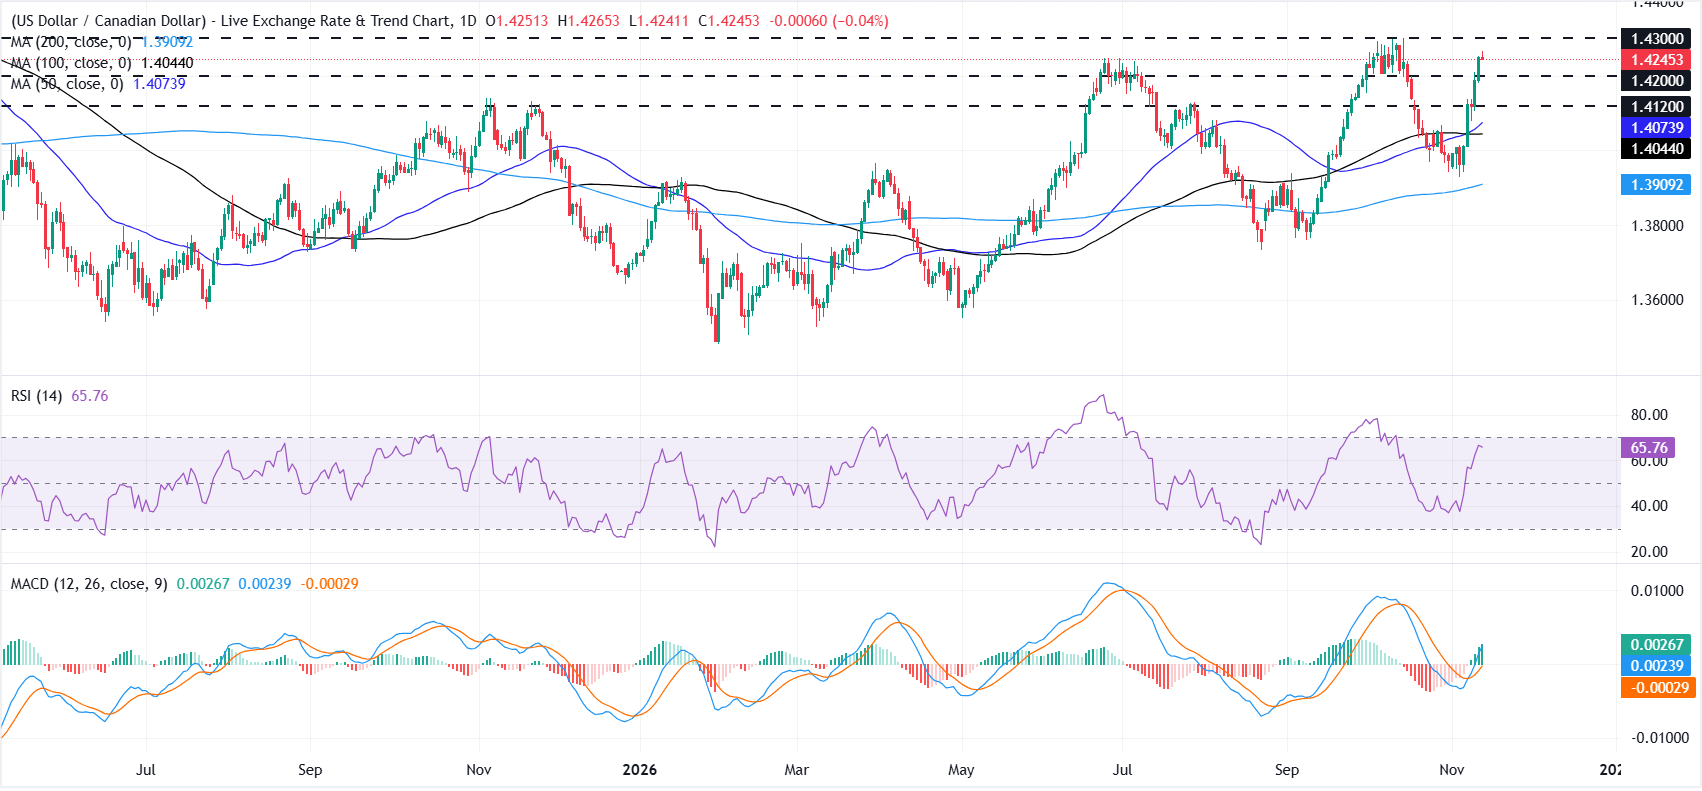
USD/CAD bulls have the upper hand. The pair has erased all of its October losses and climbed above the 50-day and 100-day Simple Moving Averages (SMAs), with the 200-day SMA well below the current price.
Momentum conditions back the topside tone, with the Relative Strength Index (RSI) hovering around 66, edging toward overbought territory, while the Moving Average Convergence Divergence (MACD) remains positive and above its recent lows, hinting at sustained buying interest.
On the downside, initial support sits near 1.4200, followed by former resistance at 1.4120, which now acts as support. Below these, the cluster of trend-supporting averages between the 50-day SMA at 1.4074 and the 100-day SMA at 1.4044 should act as a deeper cushion ahead of the longer-term 200-day SMA at 1.3909.
On the upside, the October peak near 1.4300 offers immediate resistance. A break above it could open the door to further gains toward the 1.4400 psychological level.
(The technical analysis of this story was written with the help of an AI tool. Know more.)
Canadian Dollar FAQs
The key factors driving the Canadian Dollar (CAD) are the level of interest rates set by the Bank of Canada (BoC), the price of Oil, Canada’s largest export, the health of its economy, inflation and the Trade Balance, which is the difference between the value of Canada’s exports versus its imports. Other factors include market sentiment – whether investors are taking on more risky assets (risk-on) or seeking safe-havens (risk-off) – with risk-on being CAD-positive. As its largest trading partner, the health of the US economy is also a key factor influencing the Canadian Dollar.
The Bank of Canada (BoC) has a significant influence on the Canadian Dollar by setting the level of interest rates that banks can lend to one another. This influences the level of interest rates for everyone. The main goal of the BoC is to maintain inflation at 1-3% by adjusting interest rates up or down. Relatively higher interest rates tend to be positive for the CAD. The Bank of Canada can also use quantitative easing and tightening to influence credit conditions, with the former CAD-negative and the latter CAD-positive.
The price of Oil is a key factor impacting the value of the Canadian Dollar. Petroleum is Canada’s biggest export, so Oil price tends to have an immediate impact on the CAD value. Generally, if Oil price rises CAD also goes up, as aggregate demand for the currency increases. The opposite is the case if the price of Oil falls. Higher Oil prices also tend to result in a greater likelihood of a positive Trade Balance, which is also supportive of the CAD.
While inflation had always traditionally been thought of as a negative factor for a currency since it lowers the value of money, the opposite has actually been the case in modern times with the relaxation of cross-border capital controls. Higher inflation tends to lead central banks to put up interest rates which attracts more capital inflows from global investors seeking a lucrative place to keep their money. This increases demand for the local currency, which in Canada’s case is the Canadian Dollar.
Macroeconomic data releases gauge the health of the economy and can have an impact on the Canadian Dollar. Indicators such as GDP, Manufacturing and Services PMIs, employment, and consumer sentiment surveys can all influence the direction of the CAD. A strong economy is good for the Canadian Dollar. Not only does it attract more foreign investment but it may encourage the Bank of Canada to put up interest rates, leading to a stronger currency. If economic data is weak, however, the CAD is likely to fall.
Recommended Articles


