

AUD/JPY Price Forecast: Falling wedge breakout puts 112.00 in play

Source Fxstreet
  • AUD/JPY surges above falling wedge resistance, strengthening the bullish outlook.
  • Buyers target 111.13 before challenging SMA confluence at 111.64-111.71.
  • Break above 112.00 exposes 100-day SMA at 112.19 next.

The AUD/JPY advances late on Monday during the North American session, up 0.88%, as the cross-pair continues to trade above the resistance trendline of a ‘falling wedge,’ a bullish chart pattern that could open the door to testing higher prices. At the time of writing, the AUD/JPY trades at 110.64 after bouncing off the low of the day (LOD) of 109.86.

AUD/JPY Price Forecast: Technical outlook

Price action suggests that further upside is seen, with initial resistance resting at 111.13, the October 14 high of the day (HOD), which could act as a magnet and lift the AUD/JPY as the confluence of the 50- and 200-day Simple Moving Average (SMA) emerges as the next key resistance near 111.64-111.71. Once this area is surpassed, it will expose 112.00 and the 100-day SMA at 112.19.

On the downside, the first support for AUD/JPY is the 110.00 psychological level. A move below this milestone and towards a previous resistance trendline-turned-support at the 109.00-109.30 range are on the cards. Beneath is 109.00, followed by the October 15 low of 108.64.

AUD/JPY Price Chart – Daily
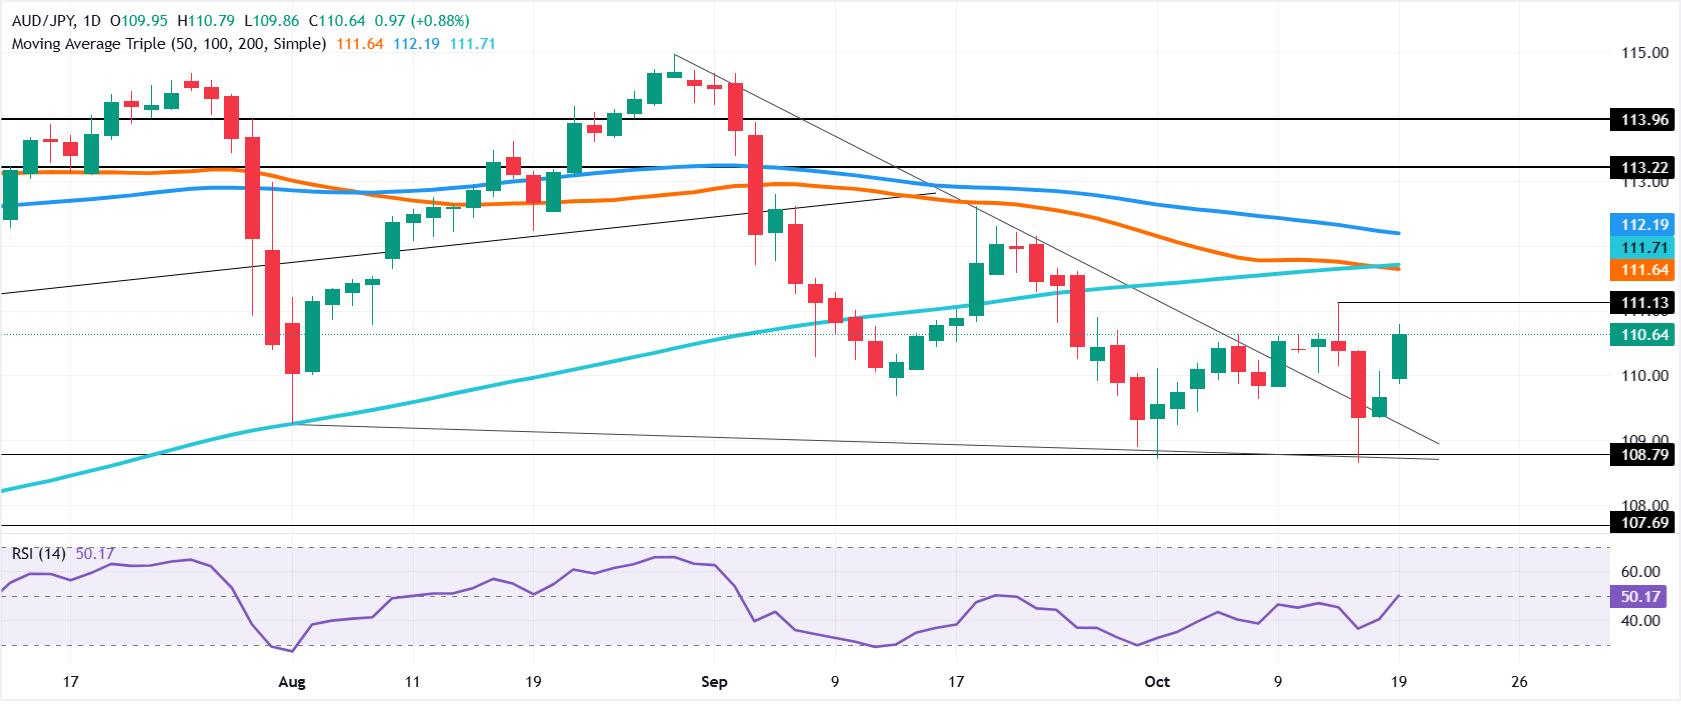
AUD/JPY daily chart

Japanese Yen FAQs

The Japanese Yen (JPY) is one of the world’s most traded currencies. Its value is broadly determined by the performance of the Japanese economy, but more specifically by the Bank of Japan’s policy, the differential between Japanese and US bond yields, or risk sentiment among traders, among other factors.

One of the Bank of Japan’s mandates is currency control, so its moves are key for the Yen. The BoJ has directly intervened in currency markets sometimes, generally to lower the value of the Yen, although it refrains from doing it often due to political concerns of its main trading partners. The BoJ ultra-loose monetary policy between 2013 and 2024 caused the Yen to depreciate against its main currency peers due to an increasing policy divergence between the Bank of Japan and other main central banks. More recently, the gradually unwinding of this ultra-loose policy has given some support to the Yen.

Over the last decade, the BoJ’s stance of sticking to ultra-loose monetary policy has led to a widening policy divergence with other central banks, particularly with the US Federal Reserve. This supported a widening of the differential between the 10-year US and Japanese bonds, which favored the US Dollar against the Japanese Yen. The BoJ decision in 2024 to gradually abandon the ultra-loose policy, coupled with interest-rate cuts in other major central banks, is narrowing this differential.

The Japanese Yen is often seen as a safe-haven investment. This means that in times of market stress, investors are more likely to put their money in the Japanese currency due to its supposed reliability and stability. Turbulent times are likely to strengthen the Yen’s value against other currencies seen as more risky to invest in.

Disclaimer: For information purposes only. Past performance is not indicative of future results.
placeholder
WTI drops to near $97.50 as US waives Russia oil sanctionsWest Texas Intermediate (WTI) oil price declines after seven days of gains, trading around 97.40 per barrel during Asian hours on Monday.
Author  FXStreet
Yesterday 01: 21
West Texas Intermediate (WTI) oil price declines after seven days of gains, trading around 97.40 per barrel during Asian hours on Monday.
placeholder
Gold Price Analysis Today | Forex Gold Analysis | XAU/USD Analysis - October 19, 2026Get the latest gold price analysis, forex gold insights, and XAU/USD analysis for October 19, 2026. Read on for the details.
Author  Mitrade
Yesterday 02: 11
Get the latest gold price analysis, forex gold insights, and XAU/USD analysis for October 19, 2026. Read on for the details.
placeholder
Gold retests $4,200 as dollar and yields retreat — can bullion clear its hardest level?Spot gold traded near $4,175 on Monday (+0.23%), with an intraday high of $4,187.71 after last week's $4,073 ~ $4,217 range; COMEX futures briefly topped $4,200. The dollar slipped to 101.76 and 10-year yields eased from their highs, but October Fed hike odds near 52% and BofA's sub-$4,000 call still cap the upside. Here are the drivers, the levels and what would flip the script.
Author  Irene Q.
23 hours ago
Spot gold traded near $4,175 on Monday (+0.23%), with an intraday high of $4,187.71 after last week's $4,073 ~ $4,217 range; COMEX futures briefly topped $4,200. The dollar slipped to 101.76 and 10-year yields eased from their highs, but October Fed hike odds near 52% and BofA's sub-$4,000 call still cap the upside. Here are the drivers, the levels and what would flip the script.
placeholder
Brent slips from $110 as Russian supply prospects return — is the five-month rally over?Brent crude traded near $108.06 on Monday (-1.71%), pulling back from last week's $110 high after Washington moved to ease restrictions on Russian oil flows. WTI hovered around $101 before dipping below $99. The retreat is real, but so is the supply-risk premium: Hormuz shipping disruptions, attacks on Saudi energy infrastructure and strikes on Russian refineries remain live. Here are the three numbers, the transmission chain and the levels that matter.
Author  Irene Q.
23 hours ago
Brent crude traded near $108.06 on Monday (-1.71%), pulling back from last week's $110 high after Washington moved to ease restrictions on Russian oil flows. WTI hovered around $101 before dipping below $99. The retreat is real, but so is the supply-risk premium: Hormuz shipping disruptions, attacks on Saudi energy infrastructure and strikes on Russian refineries remain live. Here are the three numbers, the transmission chain and the levels that matter.
placeholder
Gold Price Analysis Today | Forex Gold Analysis | XAU/USD Analysis - October 20, 2026Get the latest gold price analysis, forex gold insights, and XAU/USD analysis for October 20, 2026. Read on for the details.
Author  Mitrade
2 hours ago
Get the latest gold price analysis, forex gold insights, and XAU/USD analysis for October 20, 2026. Read on for the details.
Related Instrument
goTop
quote