


EUR/USD Price Forecast: RSI signals stretched selling pressure
- EUR/USD gains ground as a softer US Dollar offers relief ahead of Wednesday’s US CPI report.
- The daily technical outlook remains bearish as the pair trades below its key SMAs.
- An oversold RSI raises the possibility of a corrective bounce, although the ADX signals a strong downtrend.
EUR/USD trades on the front foot on Tuesday as a pullback in the US Dollar (USD) lifts the Euro (EUR). Despite the modest recovery, the pair remains near 17-month lows as fiscal and political concerns in France weigh on the single currency, while the technical picture suggests sellers remain firmly in control. At the time of writing, the pair trades around 1.1200, up 0.41% on the day. US Consumer Price Index (CPI) report due on Wednesday could determine whether the Euro extends its rebound or faces renewed losses.
Euro under pressure as France risk premium lingers and EUR/USD tests lower range
Analysts at ING estimate that EUR/USD is currently "around 1.5% undervalued relative to short-term fundamentals," arguing that this points to a moderate France-related risk premium that "may be becoming entrenched in the Euro," and could yet "expand further if French bonds continue to lose value." For now, ING stresses that this is "not our baseline," noting that while "it’s early to call for a retightening of the OAT-Bund 10yr gap," expectations that this year's French budget can be passed via decree "may help contain the spread below 150-160bp."
ING cautions that "it’s hardly a welcoming environment for EUR bulls," with "few other domestic drivers for the Euro this week" beyond several ECB appearances, including President Christine Lagarde. The bank adds that "markets are already fully priced for a December hike, leaving limited scope for additional hawkish support, while an October move still looks unlikely."
Against this backdrop, ING warns that "a test of 1.110 remains the risk for EUR/USD, even if we expect some stabilisation today," and confirms it has "revised our EUR/USD forecast lower to 1.13 for 4Q26 and 1Q27." Price action has already been soft, with Societe Generale reporting an overnight EUR/USD range of "1.1186 - 1.1217."
Technical Analysis
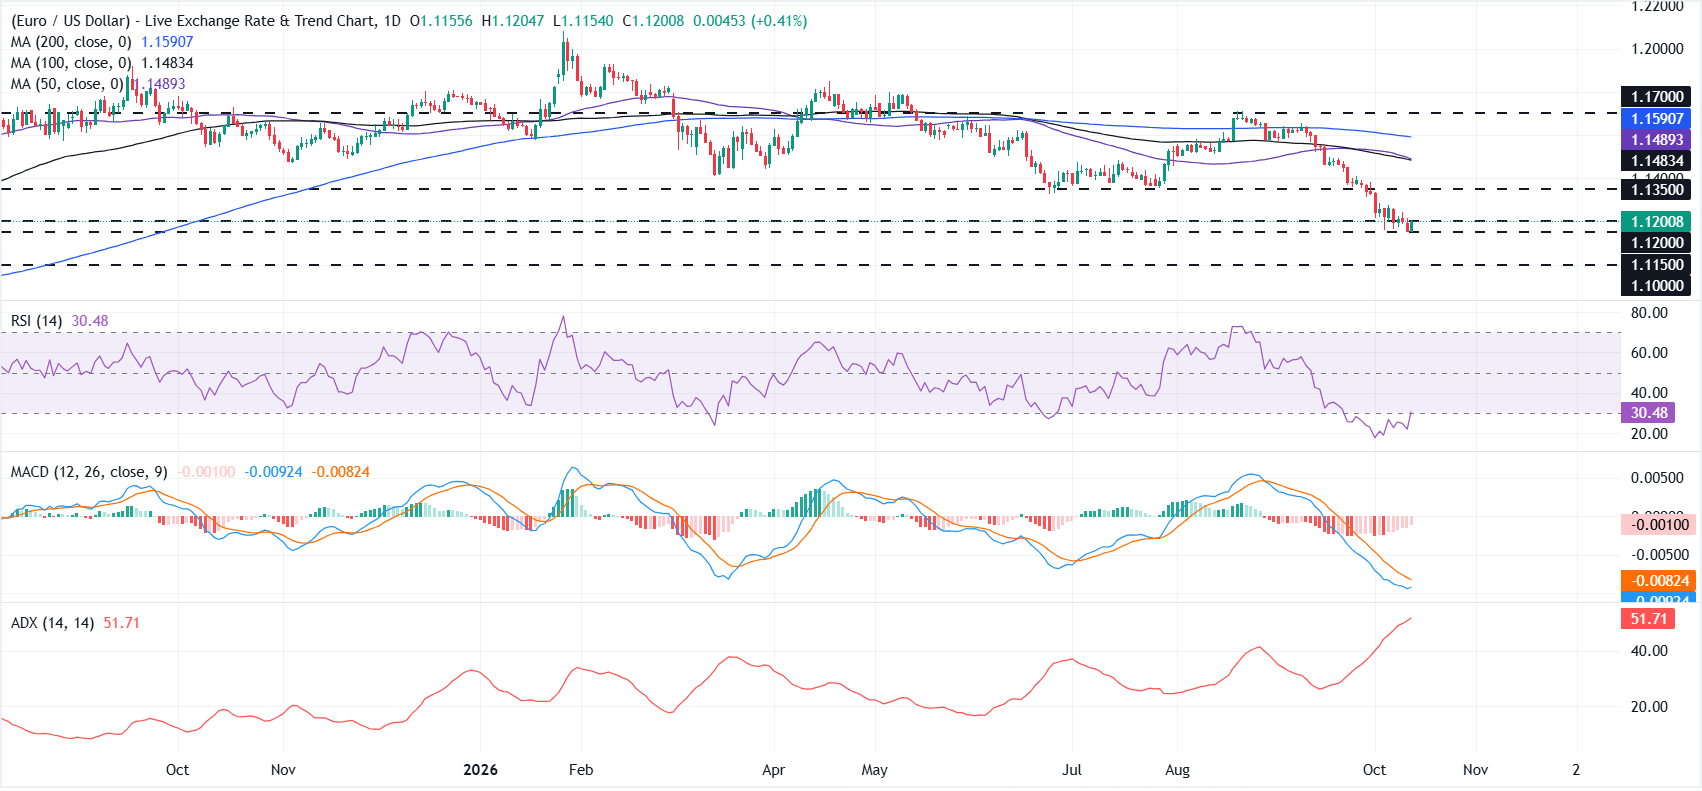
On the daily chart, EUR/USD maintains a bearish near-term bias as it trades well below the 50-day, 100-day and 200-day Simple Moving Averages (SMAs).
The Relative Strength Index (RSI) near 29 signals oversold conditions, while the Moving Average Convergence Divergence (MACD) remains in negative territory. The Average Directional Index (ADX) above 50 points to a strong prevailing downtrend, although stretched momentum leaves room for a corrective bounce.
On the topside, immediate resistance lies at the 1.1200 psychological mark, followed by 1.1350. Beyond this, the 100-day SMA at 1.1483 and the 50-day SMA at 1.1489 form a firm resistance zone. The 200-day SMA at 1.1591 presents a further hurdle ahead of 1.1700.
On the downside, initial support stands at 1.1150. A break below this level could open the door to the 1.1000 psychological mark.
(The technical analysis of this story was written with the help of an AI tool. Know more.)
Euro Price This Month
The table below shows the percentage change of Euro (EUR) against listed major currencies this month. Euro was the weakest against the Australian Dollar.
| USD | EUR | GBP | JPY | CAD | AUD | NZD | CHF | |
|---|---|---|---|---|---|---|---|---|
| USD | 1.15% | 0.07% | 0.54% | -0.17% | -0.52% | 0.27% | -0.42% | |
| EUR | -1.15% | -1.07% | -0.60% | -1.32% | -1.68% | -0.88% | -1.53% | |
| GBP | -0.07% | 1.07% | 0.44% | -0.24% | -0.64% | 0.21% | -0.39% | |
| JPY | -0.54% | 0.60% | -0.44% | -0.75% | -1.11% | -0.23% | -0.92% | |
| CAD | 0.17% | 1.32% | 0.24% | 0.75% | -0.37% | 0.51% | -0.23% | |
| AUD | 0.52% | 1.68% | 0.64% | 1.11% | 0.37% | 0.80% | 0.18% | |
| NZD | -0.27% | 0.88% | -0.21% | 0.23% | -0.51% | -0.80% | -0.67% | |
| CHF | 0.42% | 1.53% | 0.39% | 0.92% | 0.23% | -0.18% | 0.67% |
The heat map shows percentage changes of major currencies against each other. The base currency is picked from the left column, while the quote currency is picked from the top row. For example, if you pick the Euro from the left column and move along the horizontal line to the US Dollar, the percentage change displayed in the box will represent EUR (base)/USD (quote).
Recommended Articles


