


EUR/USD Price Forecast: Buyers eye a break above the 100-day SMA
- EUR/USD holds near a seven-week high as weak US payrolls weigh on the US Dollar.
- Bullish RSI and MACD readings suggest buyers retain the upper hand.
- The 100-day SMA caps immediate gains, with a break exposing the 200-day SMA.
EUR/USD edges higher on Friday, supported by a softer US Dollar (USD) as traders scale back Federal Reserve (Fed) rate-hike bets following a disappointing US Nonfarm Payrolls (NFP) report. At the time of writing, the pair trades around 1.1562, hovering near a seven-week high.
Price action, however, has been confined to a narrow range for more than a week, with the 100-day Simple Moving Average (SMA) capping immediate upside attempts after the pair staged a rebound from below 1.1400 in late July.
Still, the near-term outlook remains bullish, as the dovish repricing of Fed rate expectations and optimism surrounding peace in the Middle East and the reopening of the Strait of Hormuz could keep the US Dollar on the defensive. The EUR/USD recovery faces its next major test from the US Consumer Price Index (CPI) data due next week.
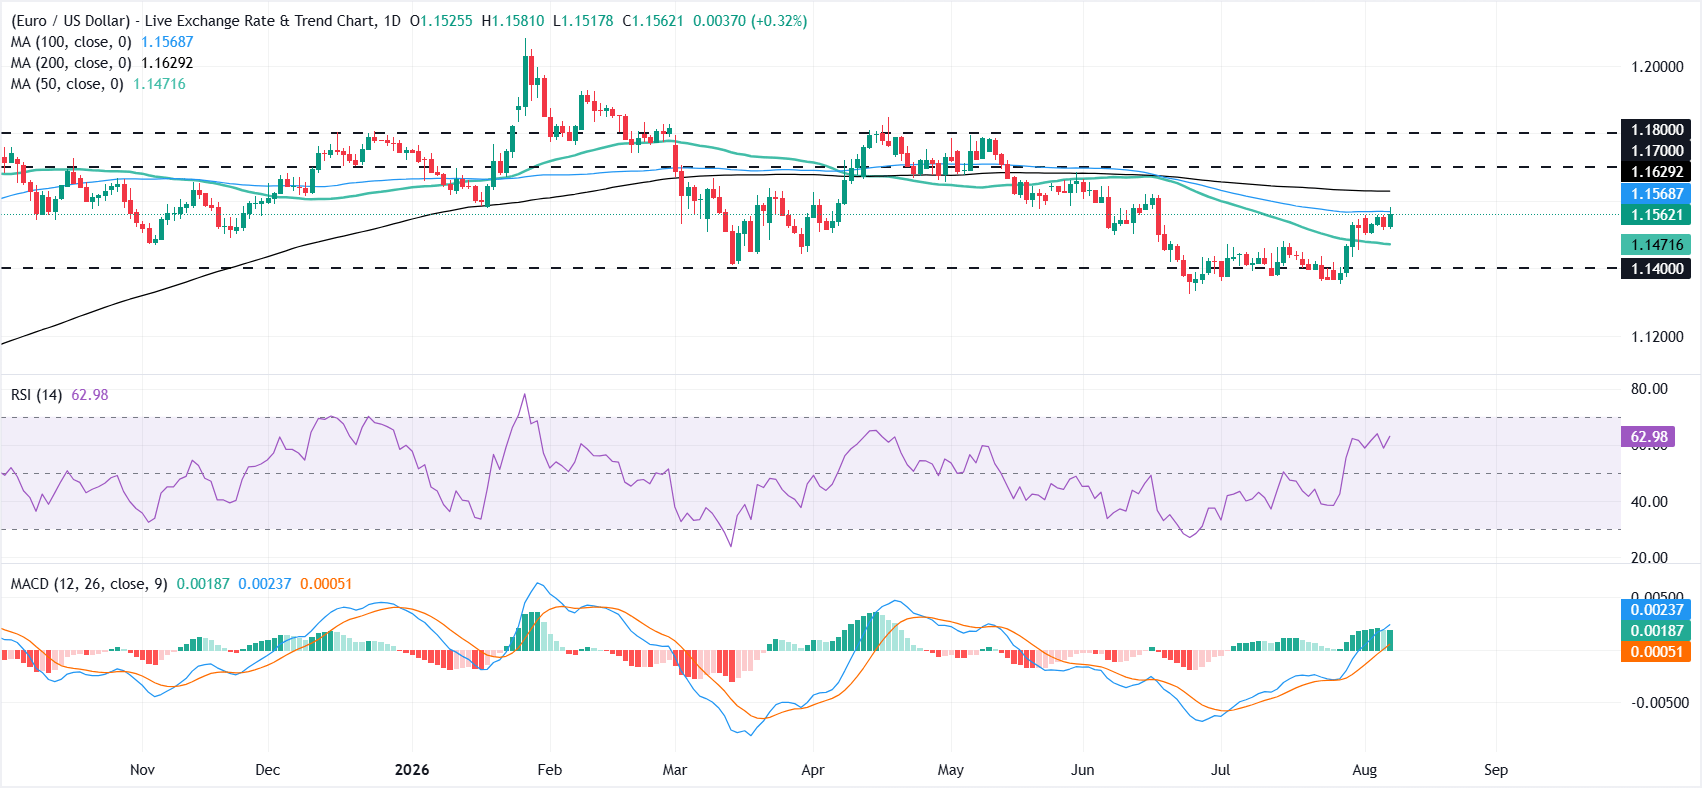
From a technical perspective, the daily chart shows that the 50-day SMA at 1.1471 offers immediate support, followed by the 1.1400 psychological mark.
The Relative Strength Index (RSI) at 63 points to bullish momentum, while the Moving Average Convergence Divergence (MACD) indicator stays positive, which hints that buyers retain an edge as long as price holds over the short-term average.
On the topside, immediate resistance is located at the 100-day SMA at 1.1568, followed by the 200-day SMA at 1.1629. A sustained break above these levels would expose the horizontal barriers at 1.1700 and 1.1800.
(The technical analysis of this story was written with the help of an AI tool. Know more.)
Economic Indicator
Consumer Price Index (MoM)
Inflationary or deflationary tendencies are measured by periodically summing the prices of a basket of representative goods and services and presenting the data as The Consumer Price Index (CPI). CPI data is compiled on a monthly basis and released by the US Department of Labor Statistics. The MoM figure compares the prices of goods in the reference month to the previous month.The CPI is a key indicator to measure inflation and changes in purchasing trends. Generally, a high reading is seen as bullish for the US Dollar (USD), while a low reading is seen as bearish.
Read more.Next release: Wed Aug 12, 2026 12:30
Frequency: Monthly
Consensus: 0.1%
Previous: -0.4%
Source: US Bureau of Labor Statistics
The US Federal Reserve (Fed) has a dual mandate of maintaining price stability and maximum employment. According to such mandate, inflation should be at around 2% YoY and has become the weakest pillar of the central bank’s directive ever since the world suffered a pandemic, which extends to these days. Price pressures keep rising amid supply-chain issues and bottlenecks, with the Consumer Price Index (CPI) hanging at multi-decade highs. The Fed has already taken measures to tame inflation and is expected to maintain an aggressive stance in the foreseeable future.
Recommended Articles


