

Silver Price Forecasts: XAG/USD picks up above $64.00 with bears still in control
- Silver nudges up to levels above $64.00 after bouncing from more than two-month lows, at $61.50.
- Reports pointing to ongoing US-Iran negotiations have provided some support to
- XAG/USD remains vulnerable while below the $66.00 area.
Silver (XAG/USD) appreciates on Thursday, reaching session highs at $64.50 at the time of writing, after hitting two-and-a-half-month lows at $61.50 earlier on the day. News about ongoing negotiations between the US and Iran has soothed markets, providing some support to the ailing white metal.
CNN News reported earlier on Thursday that US-Iran talks are still on track, citing a diplomatic source, which raises hopes of a negotiated end to the war. The precious metal had extended its decline earlier on the day, as the US launched a new round of attacks on Iran’s military sites and Tehran responded by targeting US assets in the area.
In the US, Consumer Price Index (CPI) figures released on Wednesday showed that inflation rose at its fastest yearly pace in more than three years, increasing hopes that the Federal Reserve (Fed) will be forced to hike interest rates at least once this year. The CPI release sent US Treasury yields and the US Dollar higher, adding weight on precious metals.
Technical Analysis: Silver remains vulnerable while below $66.00
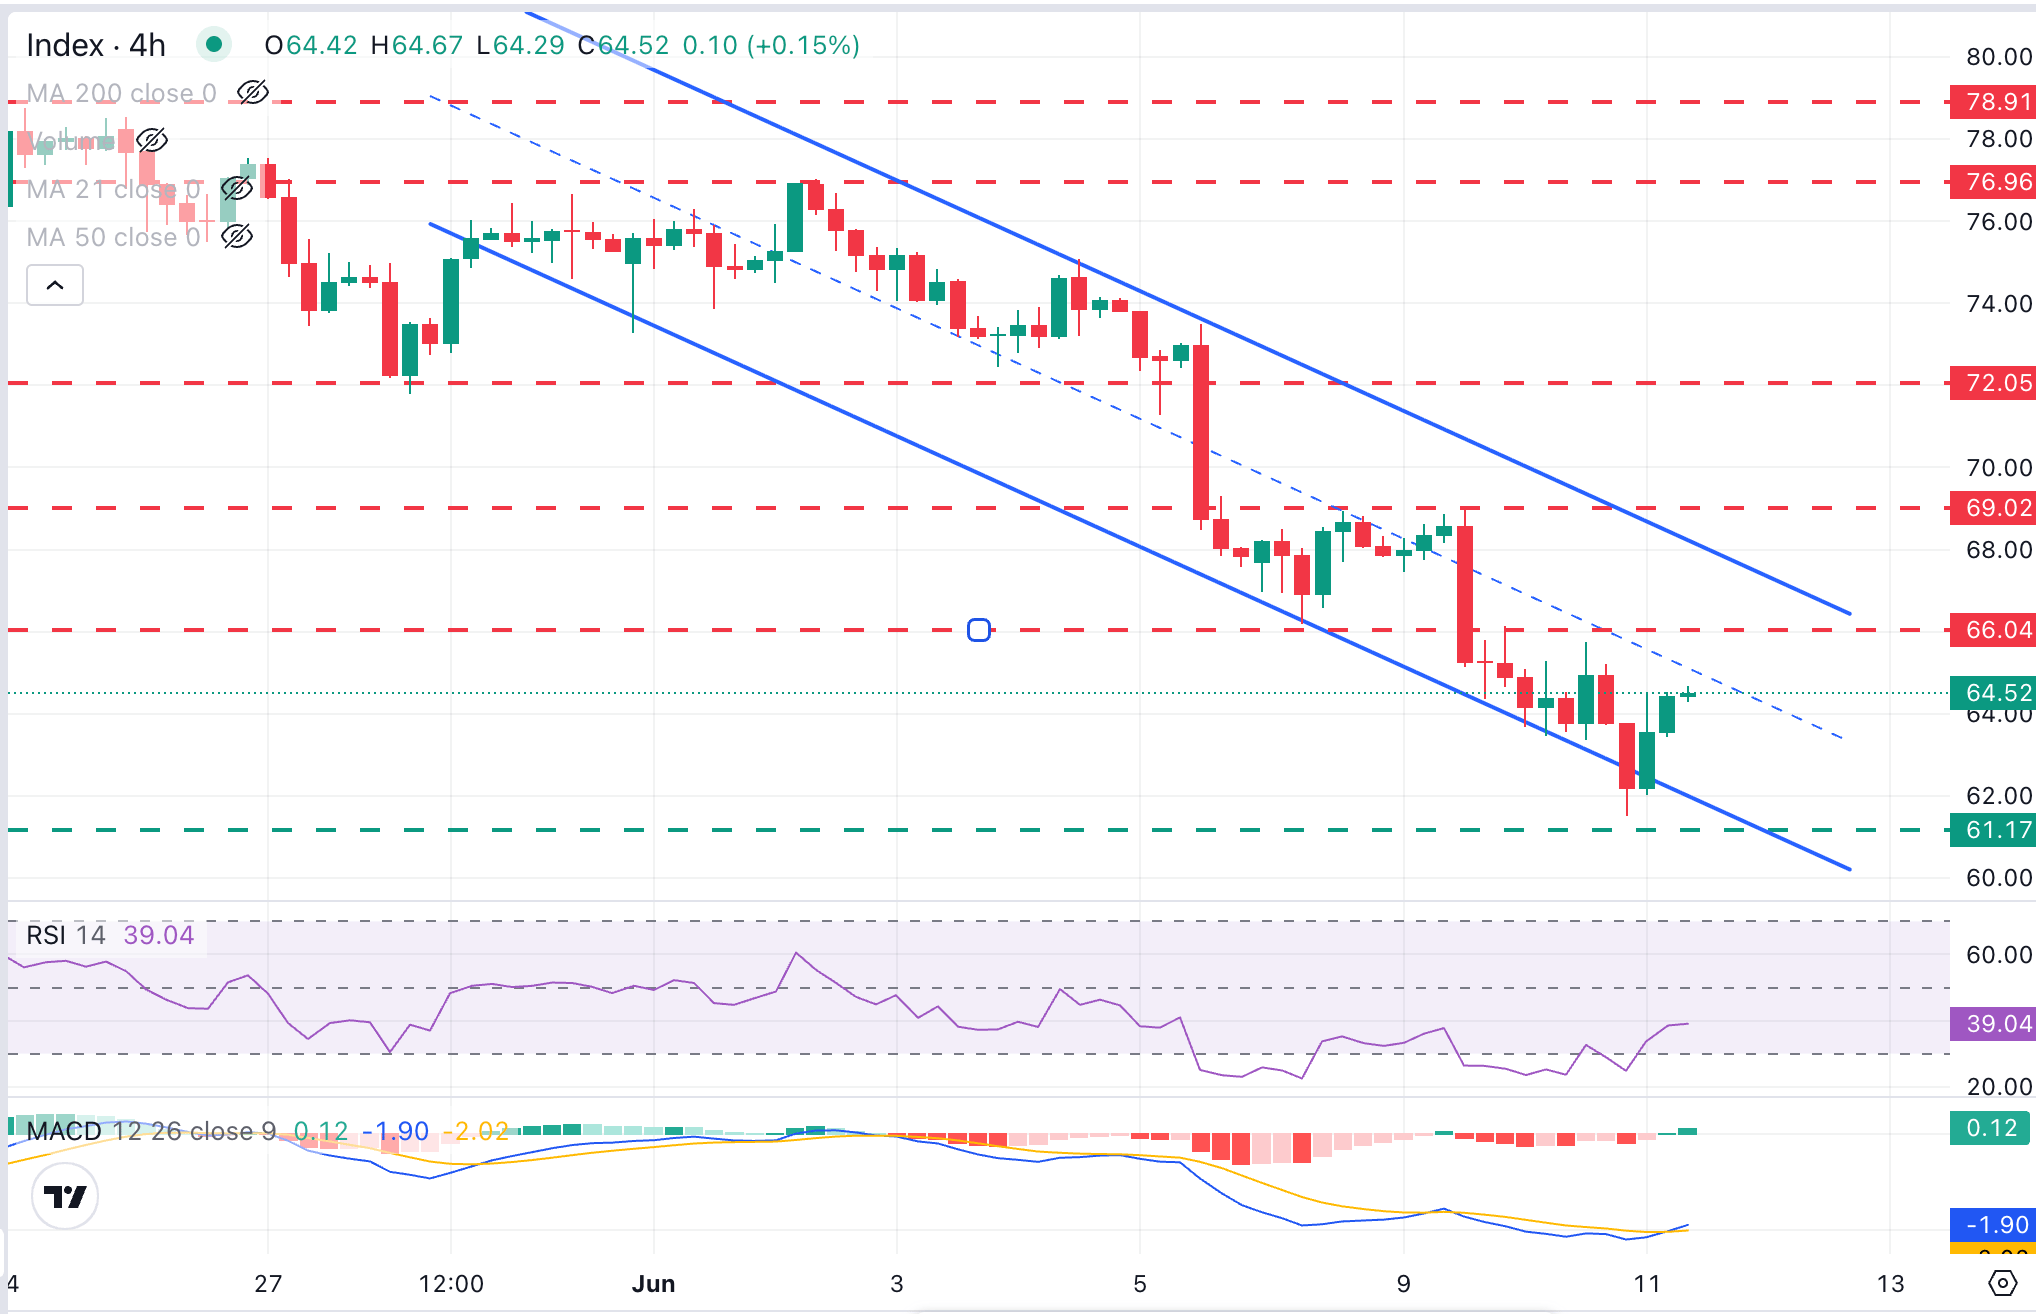
XAG/USD bounces up from oversold levels but retains the bearish near-term bias intact, with upside attempts likely to meet significant resistance at a previous support zone above $66.00. Momentum indicators remain soft, with the 4-hour Relative Strength Index below the key 50 level and the Moving Average Convergence Divergence (MACD) near zero, suggesting lower downside pressure rather than a decisive reversal.
Bulls would have to breach the June 8 low at $66.04 to ease downside pressure and shift the focus to the confluence of the bearish channel's top, at $68.50, and the June 8 and 9 highs around the $69.00 area.
On the downside, the pair might find support at the channel floor, now around $62.00, although the key support area is the year-to-date low, near $61.00. Further down, the next target would be the $60.00 psychological area.
(The technical analysis of this story was written with the help of an AI tool.)
Silver FAQs
Silver is a precious metal highly traded among investors. It has been historically used as a store of value and a medium of exchange. Although less popular than Gold, traders may turn to Silver to diversify their investment portfolio, for its intrinsic value or as a potential hedge during high-inflation periods. Investors can buy physical Silver, in coins or in bars, or trade it through vehicles such as Exchange Traded Funds, which track its price on international markets.
Silver prices can move due to a wide range of factors. Geopolitical instability or fears of a deep recession can make Silver price escalate due to its safe-haven status, although to a lesser extent than Gold's. As a yieldless asset, Silver tends to rise with lower interest rates. Its moves also depend on how the US Dollar (USD) behaves as the asset is priced in dollars (XAG/USD). A strong Dollar tends to keep the price of Silver at bay, whereas a weaker Dollar is likely to propel prices up. Other factors such as investment demand, mining supply – Silver is much more abundant than Gold – and recycling rates can also affect prices.
Silver is widely used in industry, particularly in sectors such as electronics or solar energy, as it has one of the highest electric conductivity of all metals – more than Copper and Gold. A surge in demand can increase prices, while a decline tends to lower them. Dynamics in the US, Chinese and Indian economies can also contribute to price swings: for the US and particularly China, their big industrial sectors use Silver in various processes; in India, consumers’ demand for the precious metal for jewellery also plays a key role in setting prices.
Silver prices tend to follow Gold's moves. When Gold prices rise, Silver typically follows suit, as their status as safe-haven assets is similar. The Gold/Silver ratio, which shows the number of ounces of Silver needed to equal the value of one ounce of Gold, may help to determine the relative valuation between both metals. Some investors may consider a high ratio as an indicator that Silver is undervalued, or Gold is overvalued. On the contrary, a low ratio might suggest that Gold is undervalued relative to Silver.
Recommended Articles


