


Canadian Dollar steady on Monday, BoC CPI inflation around the corner
- Canadian Dollar mostly higher but flat against Greenback again.
- Canada brings BoC CPI inflation to the table on Tuesday.
- Fedspeak dominates headlines, CAD volumes thin on holiday Monday.
The Canadian Dollar (CAD) is broadly higher on Monday, though momentum remains limited with Canadian markets shuttered for the Victoria Day holiday. CAD traders will officially kick the trading week off on Tuesday, just in time for the Bank of Canada’s (BoC) latest Consumer Price Index (CPI) inflation.
Canada is taking the day off, leaving Fedspeak the key market force on Monday as Federal Reserve (Fed) officials make a slew of appearances. Fed policymakers are walking a fine line between hawkish and bullish as the US central bank tries to balance sky-high market expectations for rate cuts with a mixed data outlook. The Fed remains concerned that inflation could remain a tricky problem to solve, but investors are adamant that the Fed is due for a first rate cut in September.
Daily digest market movers: Canadian Dollar finds room to grow, but limited against Greenback
- Canadian Dollar recovers ground, but Greenback takes top spot on Monday, climbing higher and further.
- Fed speakers flood the newswires on Monday, stressing the need for patience on rate moves with inflation expected by Fed staff to remain too high for too long.
- Canada’s CPI inflation for the year ended April is expected to tick down to 2.7% from 2.9%.
- The BoC’s own Core CPI inflation tracker last came in at 2.0% YoY.
- Tuesday will feature even more Fed appearances, filling investors’ viewports.
- Fed officials speak cautiously on policy outlook after April inflation report
Canadian Dollar PRICE Today
The table below shows the percentage change of Canadian Dollar (CAD) against listed major currencies today. Canadian Dollar was the strongest against the New Zealand Dollar.
| USD | EUR | GBP | JPY | CAD | AUD | NZD | CHF | |
|---|---|---|---|---|---|---|---|---|
| USD | 0.03% | -0.12% | 0.31% | 0.01% | 0.27% | 0.33% | 0.03% | |
| EUR | -0.03% | -0.18% | 0.32% | -0.01% | 0.28% | 0.31% | 0.00% | |
| GBP | 0.12% | 0.18% | 0.36% | 0.17% | 0.45% | 0.48% | 0.18% | |
| JPY | -0.31% | -0.32% | -0.36% | -0.32% | -0.04% | 0.04% | -0.27% | |
| CAD | -0.01% | 0.01% | -0.17% | 0.32% | 0.22% | 0.32% | 0.02% | |
| AUD | -0.27% | -0.28% | -0.45% | 0.04% | -0.22% | 0.02% | -0.27% | |
| NZD | -0.33% | -0.31% | -0.48% | -0.04% | -0.32% | -0.02% | -0.30% | |
| CHF | -0.03% | -0.01% | -0.18% | 0.27% | -0.02% | 0.27% | 0.30% |
The heat map shows percentage changes of major currencies against each other. The base currency is picked from the left column, while the quote currency is picked from the top row. For example, if you pick the Canadian Dollar from the left column and move along the horizontal line to the US Dollar, the percentage change displayed in the box will represent CAD (base)/USD (quote).
Technical analysis: Canadian Dollar high, but Greenback even higher
The Canadian Dollar (CAD) is gaining ground against nearly all of its major currency peers, climbing a third of a percent against the Antipodeans and around a sixth of a percent against the Japanese Yen (JPY). On the low side, the CAD is shedding around a tenth of a percent against the market’s top performers on Monday, the Pound Sterling (GBP) and the US Dollar (USD).
USD/CAD continues to go sideways in the near term, treading choppy water between 1.3640 and the 1.3600 handle. Intraday price action remains hampered by the 200-hour Exponential Moving Average (EMA) at 1.3646.
Middling technical action threatens to bake into USD/CAD with daily candlesticks stuck between the 50-day and 200-day EMAs at 1.3635 and 1.3548, respectively. The 1.3600 handle remains a key technical barrier, acting as a magnet pulling down bullish momentum and a price floor hobbling further shortside progress.
USD/CAD hourly chart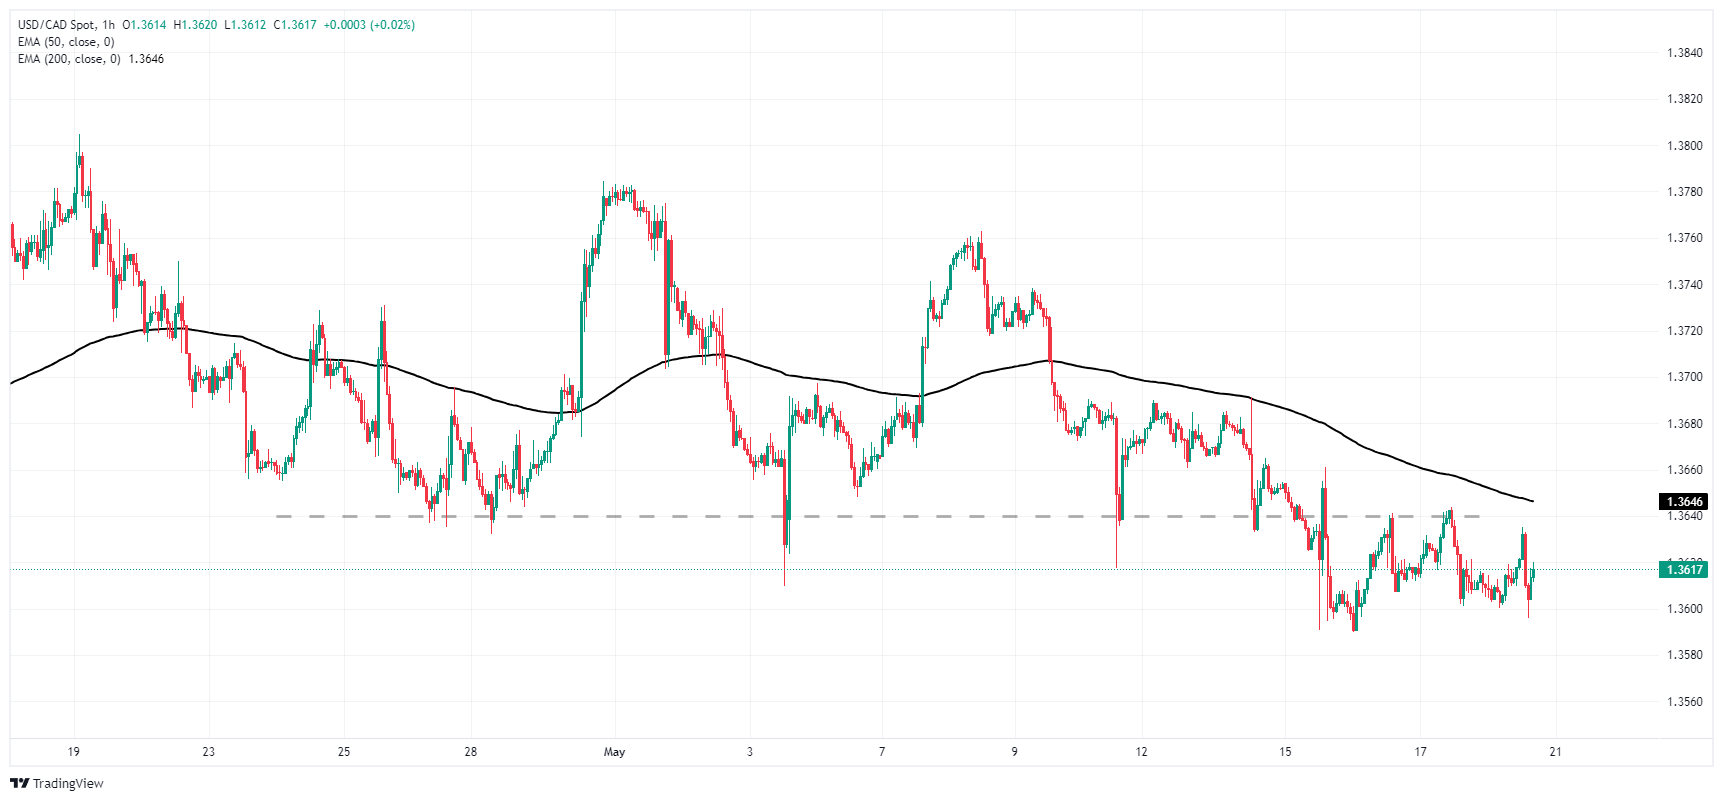
USD/CAD daily chart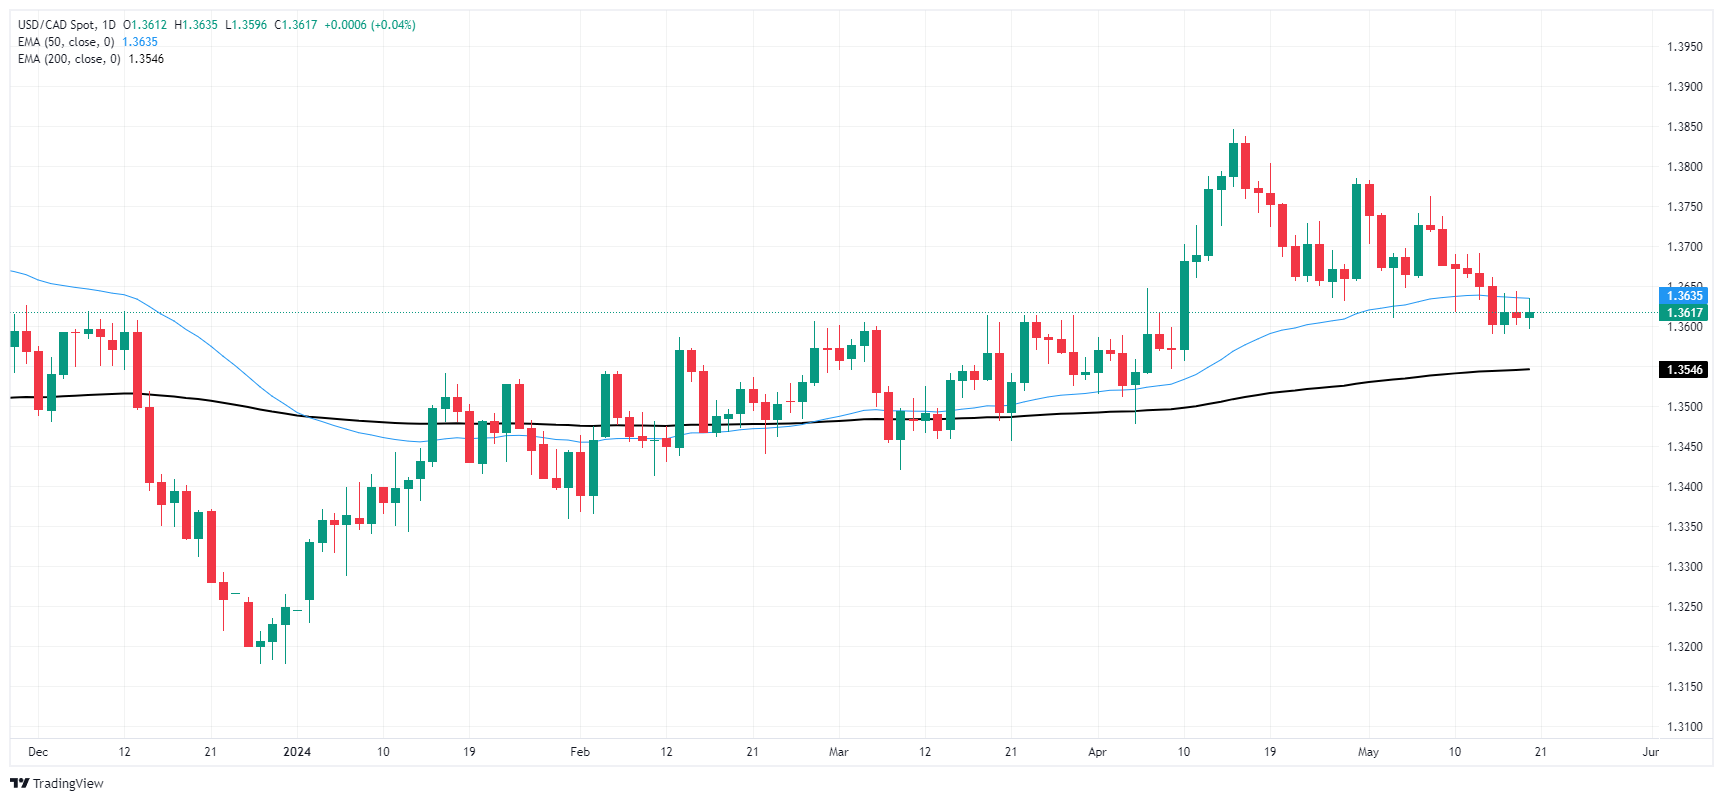
Canadian Dollar FAQs
The key factors driving the Canadian Dollar (CAD) are the level of interest rates set by the Bank of Canada (BoC), the price of Oil, Canada’s largest export, the health of its economy, inflation and the Trade Balance, which is the difference between the value of Canada’s exports versus its imports. Other factors include market sentiment – whether investors are taking on more risky assets (risk-on) or seeking safe-havens (risk-off) – with risk-on being CAD-positive. As its largest trading partner, the health of the US economy is also a key factor influencing the Canadian Dollar.
The Bank of Canada (BoC) has a significant influence on the Canadian Dollar by setting the level of interest rates that banks can lend to one another. This influences the level of interest rates for everyone. The main goal of the BoC is to maintain inflation at 1-3% by adjusting interest rates up or down. Relatively higher interest rates tend to be positive for the CAD. The Bank of Canada can also use quantitative easing and tightening to influence credit conditions, with the former CAD-negative and the latter CAD-positive.
The price of Oil is a key factor impacting the value of the Canadian Dollar. Petroleum is Canada’s biggest export, so Oil price tends to have an immediate impact on the CAD value. Generally, if Oil price rises CAD also goes up, as aggregate demand for the currency increases. The opposite is the case if the price of Oil falls. Higher Oil prices also tend to result in a greater likelihood of a positive Trade Balance, which is also supportive of the CAD.
While inflation had always traditionally been thought of as a negative factor for a currency since it lowers the value of money, the opposite has actually been the case in modern times with the relaxation of cross-border capital controls. Higher inflation tends to lead central banks to put up interest rates which attracts more capital inflows from global investors seeking a lucrative place to keep their money. This increases demand for the local currency, which in Canada’s case is the Canadian Dollar.
Macroeconomic data releases gauge the health of the economy and can have an impact on the Canadian Dollar. Indicators such as GDP, Manufacturing and Services PMIs, employment, and consumer sentiment surveys can all influence the direction of the CAD. A strong economy is good for the Canadian Dollar. Not only does it attract more foreign investment but it may encourage the Bank of Canada to put up interest rates, leading to a stronger currency. If economic data is weak, however, the CAD is likely to fall.
Recommended Articles


