

USD/CHF Price Forecast: Spot tests lower Bollinger band as bearish momentum builds
- USD/CHF trades near two-month lows as broad US Dollar weakness persists.
- Hopes for a US-Iran deal pressure the Greenback despite the latest flare-up near the Strait of Hormuz.
- Technically, USD/CHF maintains a bearish tone while trading below the 20-day SMA.
USD/CHF trades on the back foot on Friday and is set for a second straight weekly decline amid broad-based weakness in the US Dollar (USD). At the time of writing, the pair is trading around 0.7773, hovering near two-month lows.
Price action continues to be driven by geopolitical headlines surrounding the Middle East war, with markets remaining cautiously optimistic that the US and Iran could reach a deal soon. Secretary of State Marco Rubio said on Friday that the United States expects a response from Tehran on its latest peace proposal later in the day.
Improving sentiment around a possible US-Iran agreement is weighing on the Greenback, which has slipped back toward pre-war levels. The US Dollar Index (DXY), which tracks the Greenback’s value against a basket of six major currencies, is trading around 97.94, down roughly 0.34% on the day.
However, tensions remain elevated, limiting further downside in the pair after fresh reports of clashes between US and Iranian forces near the Strait of Hormuz. In the meantime, traders also digested the latest US employment report, which supports expectations that the Federal Reserve (Fed) could remain patient before cutting interest rates as inflation risks tied to higher energy prices remain elevated.
Data released by the US Bureau of Labor Statistics (BLS) showed that Nonfarm Payrolls (NFP) increased by 115K in April, beating market expectations of 62K but slowing from March’s 185K gain (revised from 178K). The Unemployment Rate held steady at 4.3%, in line with expectations.
Average Hourly Earnings rose 0.2% MoM in April, below the expected 0.3% and unchanged from the previous month. Annual wage growth accelerated to 3.6% from 3.4%, below the forecast of 3.8%.
Technical Analysis:
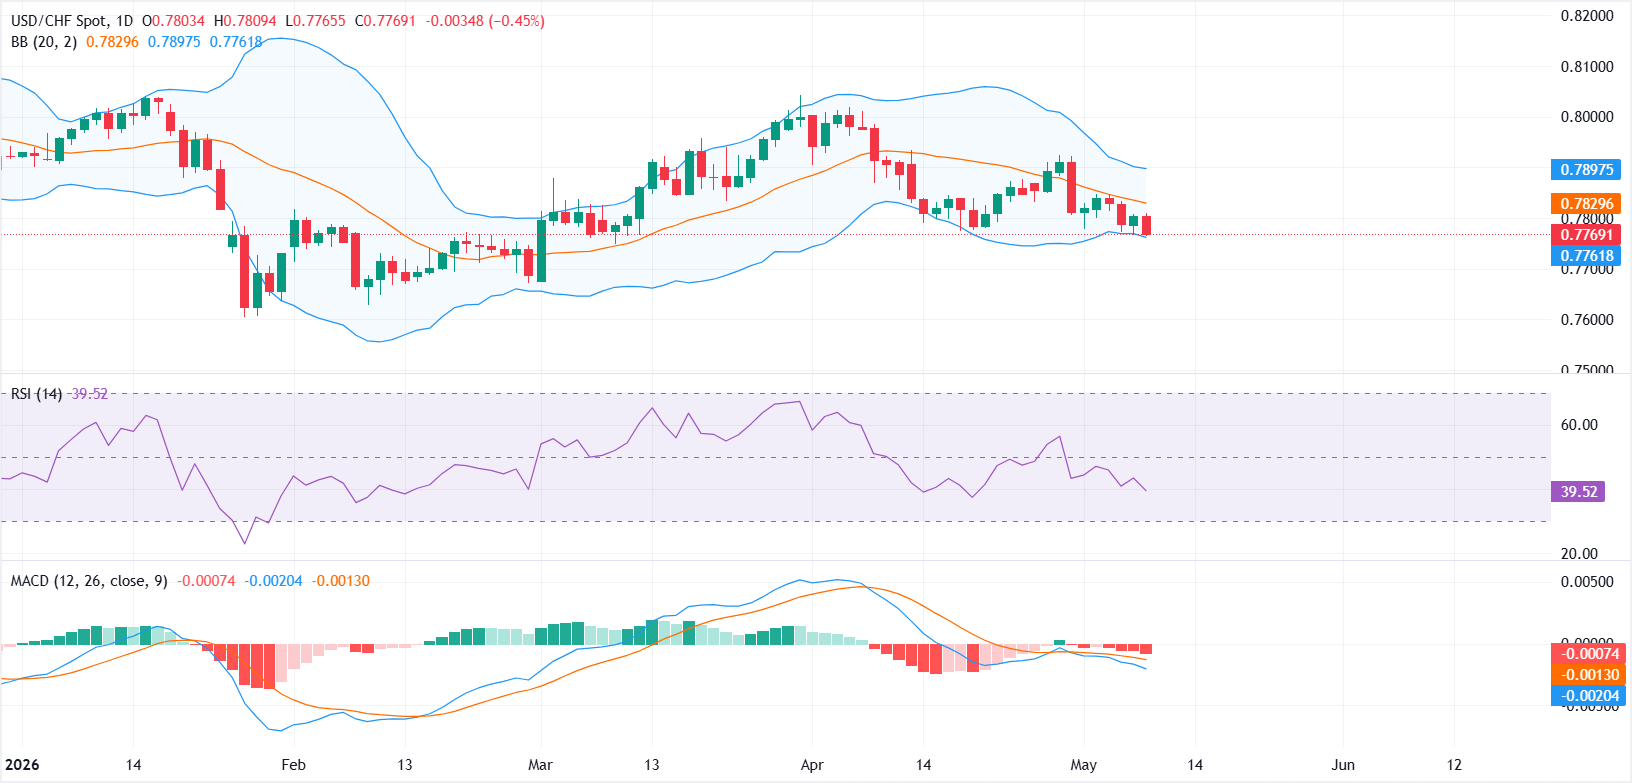
On the daily chart, USD/CHF keeps a bearish near-term tone as spot holds beneath the 20-day Simple Moving Average (the Bollinger middle band) at 0.7830 and the upper band resistance near 0.7897. Price is hovering just above the lower Bollinger band support at 0.7763, highlighting pressure on the downside, while the Relative Strength Index (14) around 40 signals weak momentum rather than oversold stress, and the negative Moving Average Convergence Divergence (MACD) reading reinforces a soft underlying bias.
On the topside, initial resistance is located at the 20-day SMA/Bollinger middle band at 0.7830, with a break exposing the upper Bollinger band at 0.7897. On the downside, the immediate level to watch is support at the lower Bollinger band around 0.7763; a daily close below this area would open the door to further losses, keeping bears in control while the pair trades under the 0.7830 cap.
(The technical analysis of this story was written with the help of an AI tool.)
Employment FAQs
Labor market conditions are a key element to assess the health of an economy and thus a key driver for currency valuation. High employment, or low unemployment, has positive implications for consumer spending and thus economic growth, boosting the value of the local currency. Moreover, a very tight labor market – a situation in which there is a shortage of workers to fill open positions – can also have implications on inflation levels and thus monetary policy as low labor supply and high demand leads to higher wages.
The pace at which salaries are growing in an economy is key for policymakers. High wage growth means that households have more money to spend, usually leading to price increases in consumer goods. In contrast to more volatile sources of inflation such as energy prices, wage growth is seen as a key component of underlying and persisting inflation as salary increases are unlikely to be undone. Central banks around the world pay close attention to wage growth data when deciding on monetary policy.
The weight that each central bank assigns to labor market conditions depends on its objectives. Some central banks explicitly have mandates related to the labor market beyond controlling inflation levels. The US Federal Reserve (Fed), for example, has the dual mandate of promoting maximum employment and stable prices. Meanwhile, the European Central Bank’s (ECB) sole mandate is to keep inflation under control. Still, and despite whatever mandates they have, labor market conditions are an important factor for policymakers given its significance as a gauge of the health of the economy and their direct relationship to inflation.
Recommended Articles


