


Mexican Peso recovers as Middle East tensions abate
- The Mexican Peso recovers as tensions in the Middle East abate temporarily.
- Several sources of geopolitical risk, however, continue to present threats to the Peso.
- A new Omicron variant of the Covid virus is spreading, though symptoms appear mild so far.
The Mexican Peso (MXN), which is especially vulnerable to geopolitical risk, is edging higher in most pairs on Monday morning as relief ripples through markets due to a temporary easing of tensions in the Middle East.
The Israel-Iran conflict has not escalated in the way markets feared. The one-off Israeli attack on a military base outside Isfahan on Friday has not led to a counter-punch from Iran as yet, and as a result, the Mexican Peso has recovered.
From a peak of 17.92 on Friday – when fears of escalation were at their most extreme – the USD/MXN has fallen to 17.02 on Monday.
On the data front, the week ahead sees the release of Mexican Economic Activity on Monday, 1st half-month inflation and core inflation on Wednesday, and Balance of Trade as well as Jobless Rate data on Friday. These are unlikely to move the dial much on MXN unless they show significant deviations from past results or estimates.
Mexican Peso is still at risk
The Mexican Peso’s sharp decline at the end of last week was triggered by geopolitical risk, which seems to be the currency’s most significant driver at the moment.
Although hostilities in the Middle East have temporarily subsided, the threat of outbreaks in the future continues to present a risk to the currency.
According to the Chief Foreign Affairs Commentator for the Financial Times, Gideon Rachman, Russia, Iran, North Korea and China now constitute an “axis of adversaries” who are working together against the West. Rachman points out that the military base outside Isfahan targeted by the Israelis is, in fact, a nuclear enrichment site which utilizes Chinese-supplied reactor technology.
Yet the Middle East is not the only potential source of geopolitical risk. Reports of a fresh strain of the Omicron variant of the Covid-19 virus have also destabilized markets at the start of the new week.
“While the WHO is urging caution, it noted that symptoms linked to the new strain so far have been mild. Because it will take some time to determine the likely impact on the global economy, we believe risk aversion will continue this week,” say analysts at private investment bank Brown Brothers Harriman in a note on Monday.
A handful of countries have already introduced minor social distancing measures, but if the strain begins to spread and pose a more serious health risk, this could present a fresh risk factor for investors, leading to a steady stream of funds into safe-havens and out of riskier assets like the Mexican Peso.
Technical Analysis: USD/MXN settles back down
USD/MXN – the value of one US Dollar in Mexican Pesos – has pulled back down after briefly breaking above a major trendline for the long-term downtrend.
The breakout higher was not enough to reverse the long-term downtrend but it did change the picture on the short-term and intermediate-term horizons, which now could be said to have reversed their bearish tenors, favoring long positions over shorts.
USD/MXN 4-hour Chart
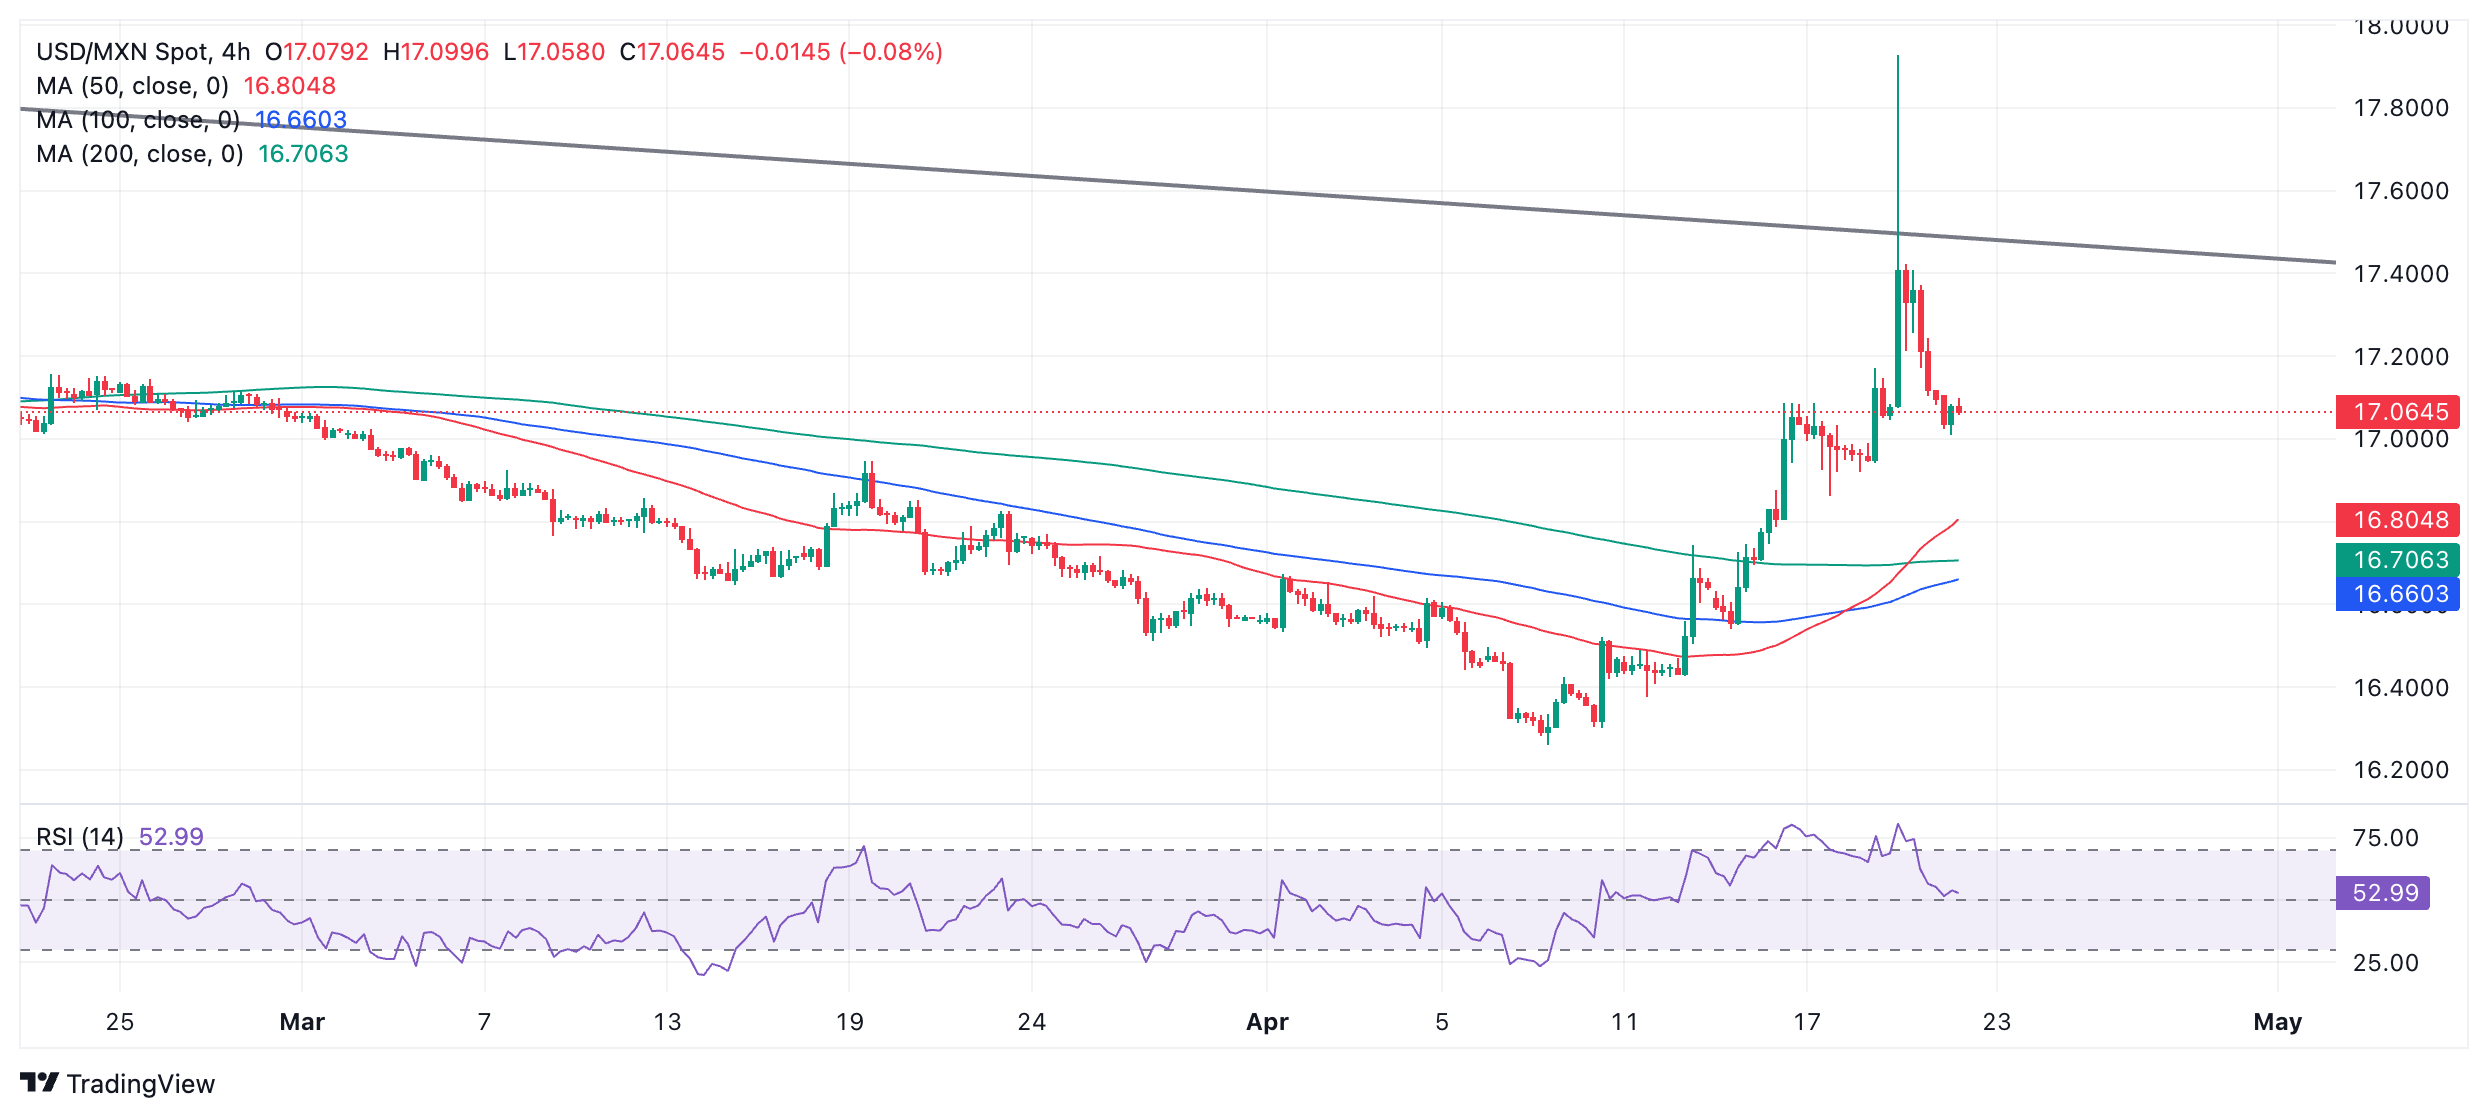
That said, the new short-term uptrend on USD/MXN is showing signs of weakness already as the pullback from Friday’s peak continues and a lack of fresh bullish momentum injects price appreciation. Support from the 200-day Simple Moving Average (SMA) at 17.17 also now appears to have been broken. A negative close on Monday would confirm a bearish Shooting Star Japanese candlestick pattern on the daily chart, with bearish overtones.
A decisive break above the trendline at roughly 17.45 would be required to provide bullish reconfirmation and activate an upside target at roughly 18.15.
A decisive break would be one characterized by a longer-than-average green daily candlestick that pierces above the trendline and closes near its high, or three green candlesticks in a row that pierce above the level.
The Relative Strength Index (RSI) has now exited overbought territory and reentered neutral ground, suggesting fresh scope for upside.
If a pullback persists, however, support from the 100-day SMA at 16.96 followed by the 50-day SMA at 16.82 is likely to provide a foothold for the backsliding price.
Mexican Peso FAQs
The Mexican Peso (MXN) is the most traded currency among its Latin American peers. Its value is broadly determined by the performance of the Mexican economy, the country’s central bank’s policy, the amount of foreign investment in the country and even the levels of remittances sent by Mexicans who live abroad, particularly in the United States. Geopolitical trends can also move MXN: for example, the process of nearshoring – or the decision by some firms to relocate manufacturing capacity and supply chains closer to their home countries – is also seen as a catalyst for the Mexican currency as the country is considered a key manufacturing hub in the American continent. Another catalyst for MXN is Oil prices as Mexico is a key exporter of the commodity.
The main objective of Mexico’s central bank, also known as Banxico, is to maintain inflation at low and stable levels (at or close to its target of 3%, the midpoint in a tolerance band of between 2% and 4%). To this end, the bank sets an appropriate level of interest rates. When inflation is too high, Banxico will attempt to tame it by raising interest rates, making it more expensive for households and businesses to borrow money, thus cooling demand and the overall economy. Higher interest rates are generally positive for the Mexican Peso (MXN) as they lead to higher yields, making the country a more attractive place for investors. On the contrary, lower interest rates tend to weaken MXN.
Macroeconomic data releases are key to assess the state of the economy and can have an impact on the Mexican Peso (MXN) valuation. A strong Mexican economy, based on high economic growth, low unemployment and high confidence is good for MXN. Not only does it attract more foreign investment but it may encourage the Bank of Mexico (Banxico) to increase interest rates, particularly if this strength comes together with elevated inflation. However, if economic data is weak, MXN is likely to depreciate.
As an emerging-market currency, the Mexican Peso (MXN) tends to strive during risk-on periods, or when investors perceive that broader market risks are low and thus are eager to engage with investments that carry a higher risk. Conversely, MXN tends to weaken at times of market turbulence or economic uncertainty as investors tend to sell higher-risk assets and flee to the more-stable safe havens.
Recommended Articles


