
USD/JPY Price Forecast: Consolidating gains around 154.00
- The Dollar hesitates around 154.00 after rallying from the 151.50 area.
- A hawkish Fed message has boosted the US Dollar across the board.
- The BoJ's commitment to keep tightening interest rates has failed to support the JPY.
The US Dollar keeps trading within a narrow range, around 154.00, consolidating gains against a somewhat softer Japanese Yen. The Grrenback rallied from the mid-range of the 151.00s last week, following the Federal Reserve (Fed) and the Bank of Japan (BoJ) monetary policy decisions, and today, investors are awaiting US manufacturing activity data for further insight about the economic outlook and the US central bank's immediate rate path.
The US Dollar maintains its firm tone after the Fed chairman, Jerome Powell, played down market hopes that the bank would lower borrowing costs further in December. The Yen, on the other hand, was hit by the Bank of Japan's decision to keep interest rates on hold, despite Governor Ueda's comments maintaining the commitment to monetary tightening.
Technical Analysis: USD/JPY is forming a smapp triangle pattern
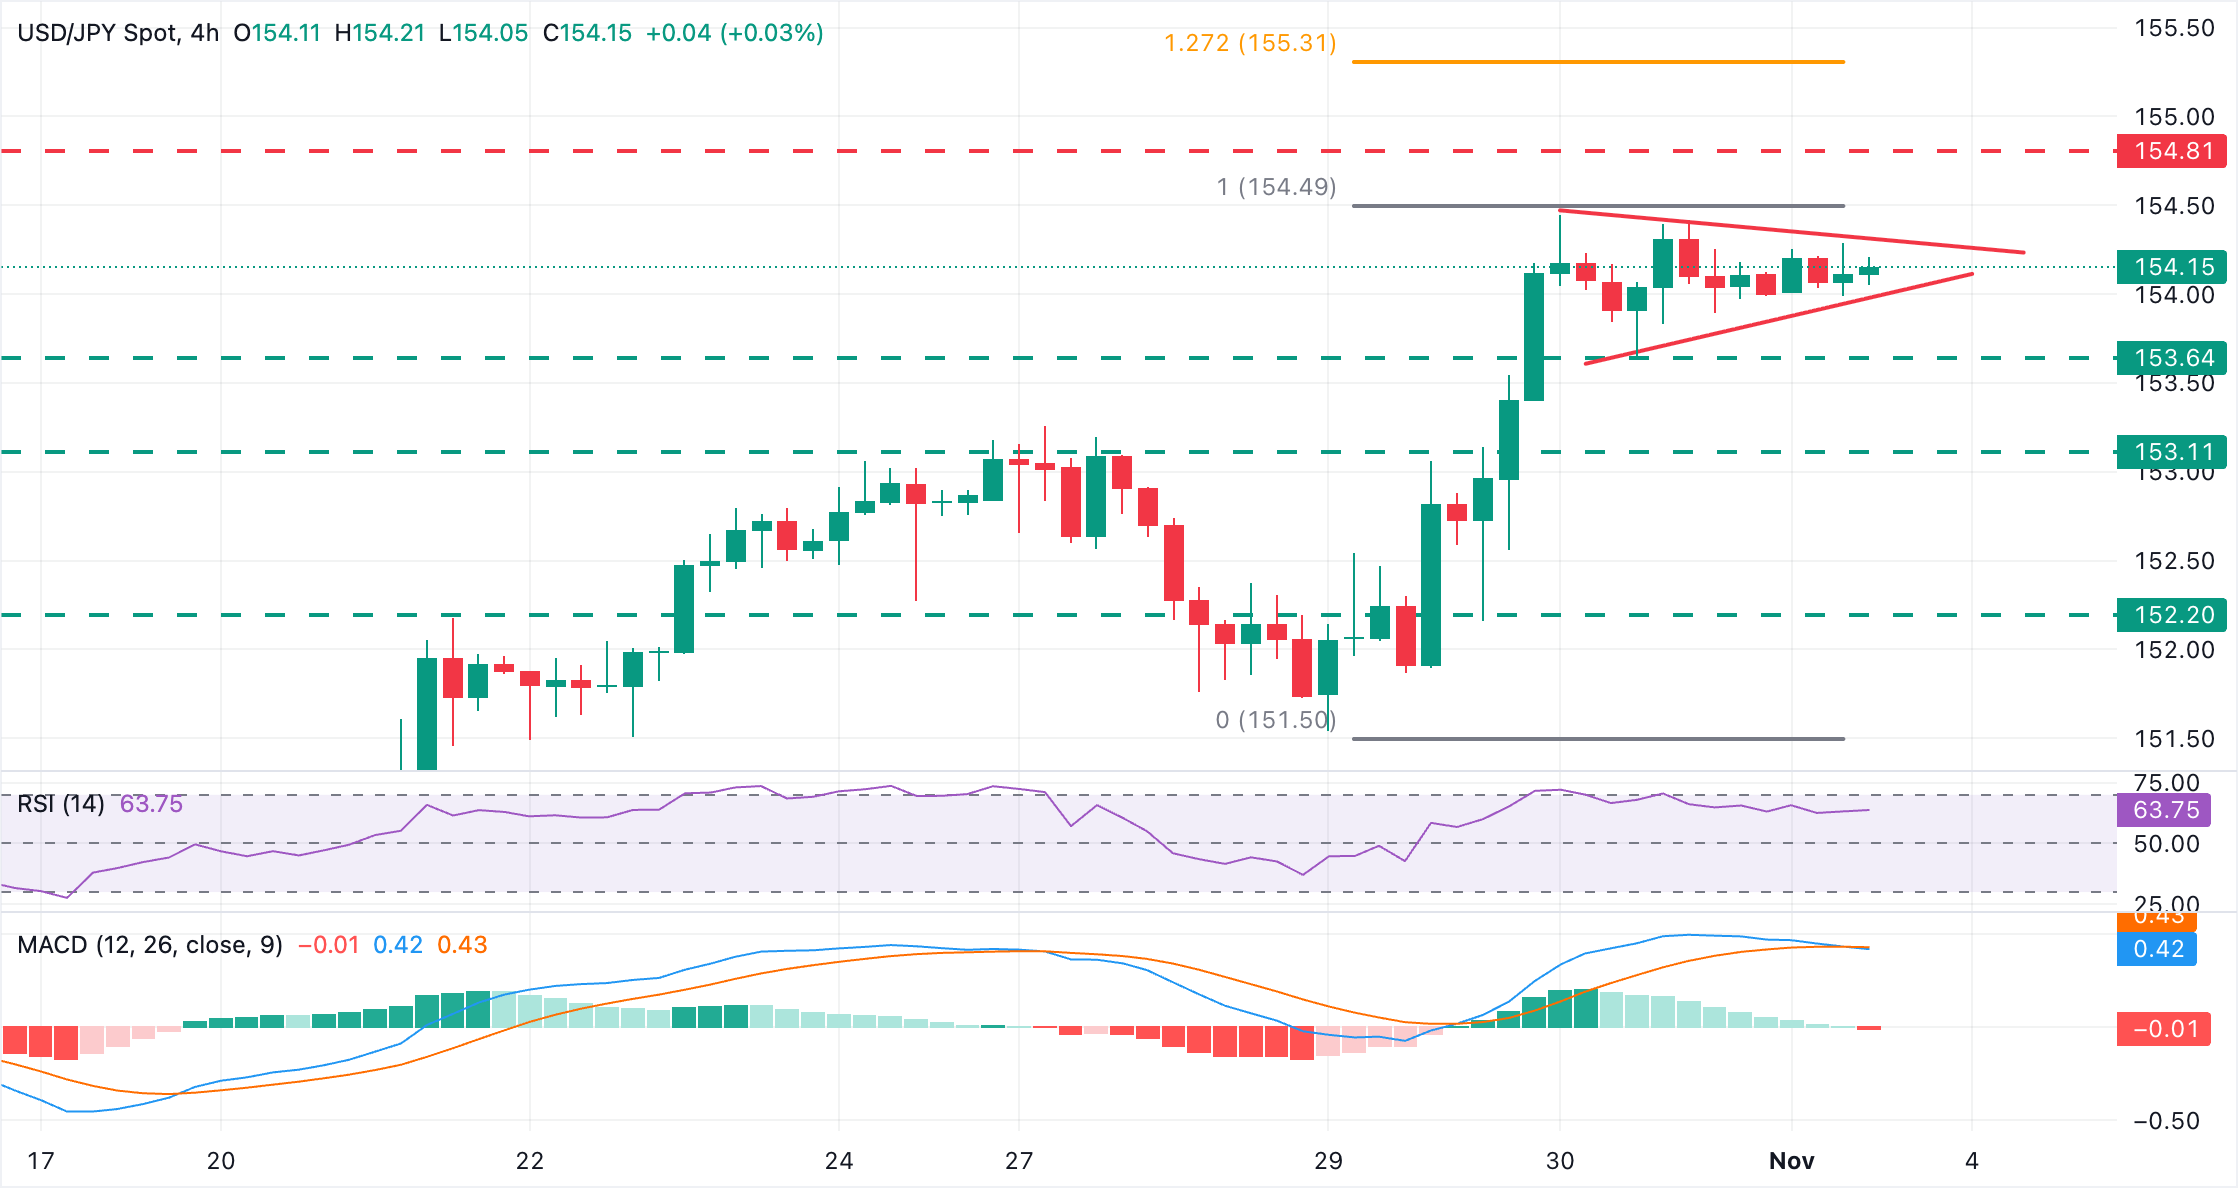
Recent price action is showing a small triangle pattern with its axis right above 154.00. The triangle is considered a continuation pattern, which suggests a positive outcome. Technical indicators are mixed. The 4-hour Relative Strength Index (RSI) remains well above the key 50 level, although the Moving Average Convergence Divergence is about to cross below the signal line, pointing to the possibility of a deeper correction.
To the upside, the triangle top is now around 154.30, and the October 30 high lies at 154.45. Further up, the target is the February 13 high, at 154.85. The 127.2% extension of last week's rally, at 155.30, is a plausible target further up.
A bearish reaction, on the contrary, would have to breach Friday's low, at 153.65 to test support at previous resistances in the area between 153.00 and 153.25 (October 29, 27 highs) ahead of the October 30 low, at 152.20.
US Dollar Price Today
The table below shows the percentage change of US Dollar (USD) against listed major currencies today. US Dollar was the strongest against the Swiss Franc.
| USD | EUR | GBP | JPY | CAD | AUD | NZD | CHF | |
|---|---|---|---|---|---|---|---|---|
| USD | 0.19% | 0.16% | 0.11% | 0.21% | -0.07% | -0.04% | 0.33% | |
| EUR | -0.19% | -0.02% | -0.11% | 0.02% | -0.25% | -0.22% | 0.16% | |
| GBP | -0.16% | 0.02% | -0.06% | 0.04% | -0.22% | -0.20% | 0.20% | |
| JPY | -0.11% | 0.11% | 0.06% | 0.10% | -0.15% | -0.00% | 0.26% | |
| CAD | -0.21% | -0.02% | -0.04% | -0.10% | -0.30% | -0.24% | 0.15% | |
| AUD | 0.07% | 0.25% | 0.22% | 0.15% | 0.30% | 0.04% | 0.44% | |
| NZD | 0.04% | 0.22% | 0.20% | 0.00% | 0.24% | -0.04% | 0.39% | |
| CHF | -0.33% | -0.16% | -0.20% | -0.26% | -0.15% | -0.44% | -0.39% |
The heat map shows percentage changes of major currencies against each other. The base currency is picked from the left column, while the quote currency is picked from the top row. For example, if you pick the US Dollar from the left column and move along the horizontal line to the Japanese Yen, the percentage change displayed in the box will represent USD (base)/JPY (quote).
Recommended Articles


