


Vertiv Holdings Co Stock (VRT) Moved Up by 5.23% on Oct 21: What Investors Need To Know
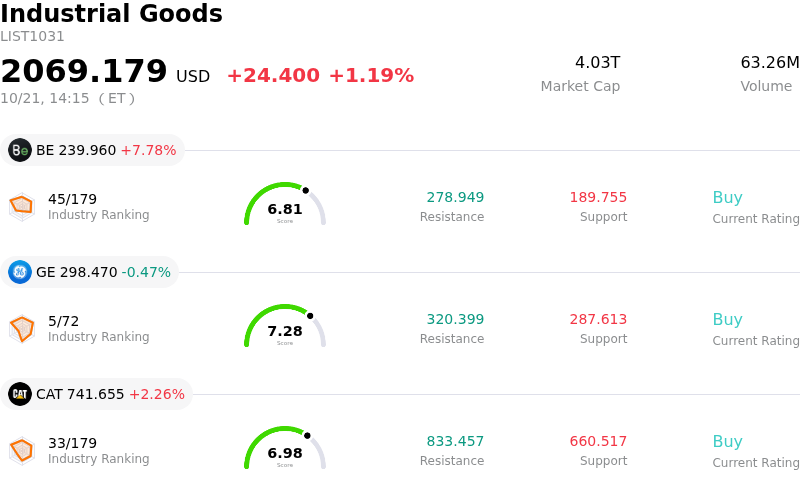
Vertiv Holdings Co (VRT) moved up by 5.23%. The Industrial Goods sector is up by 1.19%. The company outperformed the industry. Top 3 stocks by turnover in the sector: Bloom Energy Corp (BE) up 7.78%; General Electric Co (GE) down 0.47%; Caterpillar Inc (CAT) up 2.26%.
What is driving Vertiv Holdings Co (VRT)’s stock price up today?
Vertiv Holdings experienced strong upward momentum, rebounding after an extended period of short-term selling pressure. The primary catalyst driving the session's advance was a strategic announcement made alongside NVIDIA at the NVIDIA GTC Berlin conference. The two companies introduced a joint artificial intelligence factory framework aimed at accelerating data center infrastructure deployment and maximizing AI token throughput. The modular solution combines pre-engineered reference designs with factory-built execution, targeting up to a thirty percent increase in cumulative token output during its first year of operation. Immediate adoption by Polar Data Centers for its multi-megawatt facility in Norway provided instant commercial validation, reassuring investors of Vertiv's pivotal positioning in AI cooling and power infrastructure.
The positive development provided a timely relief bounce following an eleven-session consecutive decline caused by broader tech sector pullbacks, higher interest rate pressures, and selective analyst coverage downgrades. The prior sell-off had pushed the stock into oversold territory, amplifying the positive price action as buyers stepped back in. Additionally, sentiment is being bolstered ahead of Vertiv's upcoming third-quarter financial results. Investors continue to monitor the company's expanding backlog and double-digit organic growth trajectory driven by liquid cooling demand for next-generation computing clusters. While short-term intraday volatility persists across AI infrastructure stocks, the combination of strategic technology partnerships, attractive entry levels following recent pullbacks, and solid structural tailwinds drove the upward price trajectory.
Technical Analysis of Vertiv Holdings Co (VRT)
Technically, Vertiv Holdings Co (VRT) shows a MACD (12,26,9) value of -6.322, indicating a sell signal. The RSI at 35.806 suggests neutral condition and the Williams %R at 72.924 suggests sell condition. Please monitor closely.
Fundamental Analysis of Vertiv Holdings Co (VRT)
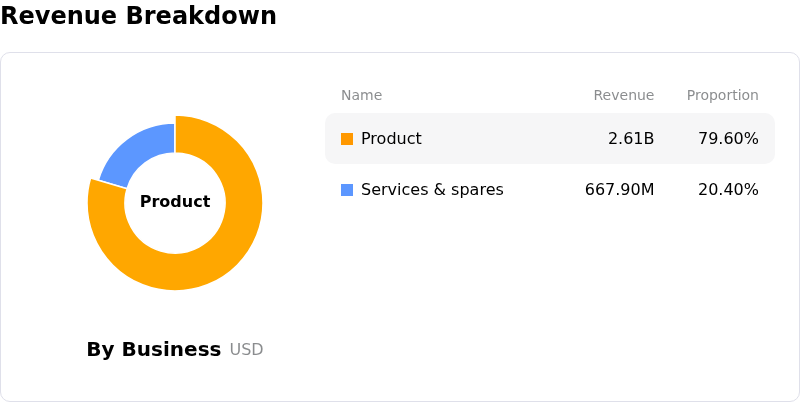
Vertiv Holdings Co (VRT) is in the Industrial Goods industry. Its latest annual revenue is $10.23B, ranking 17 in the industry. The net profit is $1.33B, ranking 13 in the industry. Company Profile
Over the past month, multiple analysts have rated the company as Buy, with an average price target of $322.66, a high of $400.00, and a low of $188.00.
More details about Vertiv Holdings Co (VRT)
Company Specific Risks:
- Data Center Buildout Financing and Customer Capex Vulnerability: Recent downside volatility across AI data center equipment suppliers has been amplified by credit market stress among major infrastructure operators, heightening institutional fears that elevated borrowing costs could restrict customer capital expenditures and defer high-margin equipment deployments.
- Project Execution Delays and Revenue Timing Slippage: Large multiphase data center installations remain vulnerable to project schedule shifts and localized supply chain congestion, which create quarterly revenue timing mismatches and undermine short-term earnings predictability.
- Significant M&A Cash Outflows and Integration Exposure: Substantial capital commitments required for recent acquisitions—including the $1.45 billion upfront cash purchase of Utility Innovation Group—substantially consume liquidity reserves and introduce operational integration risks within complex microgrid power architectures.
- Insider Equity Disposals and Wall Street Sentiment Trims: Recent SEC Form 4 disclosures highlighting executive stake reductions, alongside price target trims and rating downgrades from major brokerages, have eroded institutional support during periods of heightened market volatility.
Recommended Articles


