


Interactive Brokers Group Inc Stock (IBKR) Moved Down by 3.67% on Oct 16: A Full Analysis
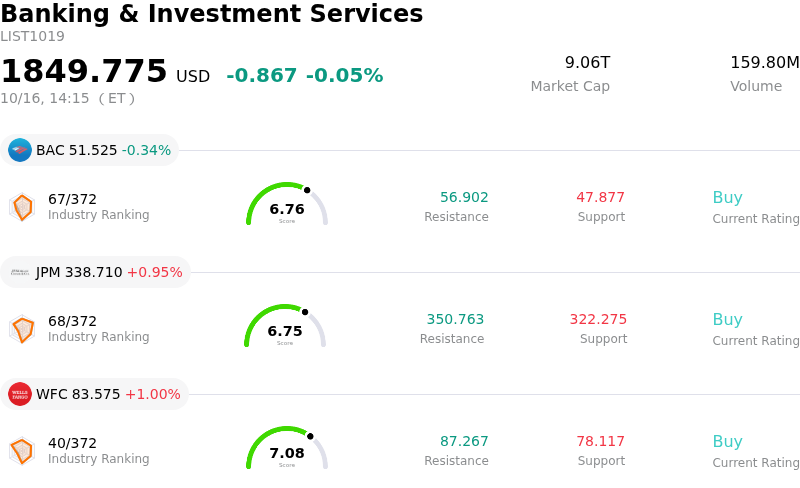
Interactive Brokers Group Inc (IBKR) moved down by 3.67%. The Banking & Investment Services sector is down by 0.05%. The company underperformed the industry. Top 3 stocks by turnover in the sector: Bank of America Corp (BAC) down 0.34%; JPMorgan Chase & Co (JPM) up 0.95%; Wells Fargo & Co (WFC) up 0.99%.
What is driving Interactive Brokers Group Inc (IBKR)’s stock price down today?
Interactive Brokers Group experienced downward price movement following the release of its third-quarter financial results. Although net revenue exceeded consensus estimates and adjusted earnings per share met market expectations, investor sentiment was dampened by underlying soft spots in trading volumes and operational cost expansion.
A primary driver of the pullback was softer equity trading activity, as customer stock trading volume contracted year-over-year. This deceleration in equity turnover caused commission revenues to miss higher institutional forecasts, signaling a moderation in active trading momentum despite overall account expansion.
Margin compression and expense growth further pressured the stock. Non-interest operating expenses rose sharply, largely due to higher execution and clearing fees driven by increased regulatory transaction rates, as well as rising compensation costs. Consequently, the pretax profit margin narrowed slightly from the prior-year period. At the same time, net interest margin compressed, fueling investor concerns regarding the sustainability of net interest income growth as interest rate dynamics evolve.
Valuation dynamics also amplified the market reaction. Heading into the earnings release, the stock had rallied significantly and traded at an elevated multiple relative to its historical averages, leaving minimal room for operational softness. Although management announced a substantial increase in the quarterly dividend and reported robust double-digit growth in total customer accounts, these positive catalysts were overshadowed by profit-taking and near-term margin headwinds.
Technical Analysis of Interactive Brokers Group Inc (IBKR)
Technically, Interactive Brokers Group Inc (IBKR) shows a MACD (12,26,9) value of -0.691, indicating a sell signal. The RSI at 37.823 suggests neutral condition and the Williams %R at 83.529 suggests oversold condition. Please monitor closely.
Media Coverage of Interactive Brokers Group Inc (IBKR)
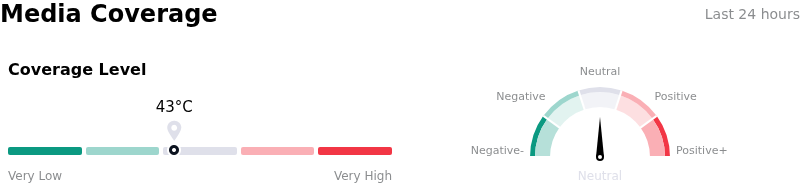
In terms of media coverage, Interactive Brokers Group Inc (IBKR) shows a coverage score of 43, indicating a moderate level of media attention. The overall market sentiment index is currently in neutral zone.
Fundamental Analysis of Interactive Brokers Group Inc (IBKR)
Interactive Brokers Group Inc (IBKR) is in the Banking & Investment Services industry. Its latest annual revenue is $10.00B, ranking 24 in the industry. The net profit is $984.00M, ranking 24 in the industry. Company Profile
Over the past month, multiple analysts have rated the company as Buy, with an average price target of $104.42, a high of $121.00, and a low of $72.18.
More details about Interactive Brokers Group Inc (IBKR)
Company Specific Risks:
- Commission Revenue and Stock Volume Softness: In its Q3 2026 financial results reported on October 15, Interactive Brokers generated $602 million in commission revenue, missing the Wall Street consensus estimate of $619 million as total Daily Average Revenue Trades (DARTs) contracted 3% sequentially and customer stock trading volume dropped 24% year-over-year.
- Net Interest Income Rate Sensitivity: With Net Interest Income (NII) representing over 60% of total revenue at $1.15 billion in Q3 2026, earnings remain acutely vulnerable to central bank rate cuts, as company models indicate every 25-basis-point drop in U.S. benchmark rates reduces annual NII by approximately $83 million.
- Stretched Valuation Multiples: Following recent equity rallies, IBKR trades at a trailing price-to-earnings ratio near 34x—substantially above its five-year median of 23x and intrinsic value metrics near $44 per share—leaving the stock highly susceptible to sharp intraday pullbacks when top-line growth metrics disappoint.
- Surging Execution and Regulatory Expenses: Execution, clearing, and distribution costs surged 46% year-over-year to $134 million for the third quarter of 2026, primarily driven by a $30 million increase in regulatory expenses from higher SEC Section 31 transaction fee rates.
Recommended Articles


