


Netflix Inc Stock (NFLX) Moved Down by 3.28% on Oct 16: Facts Behind the Movement
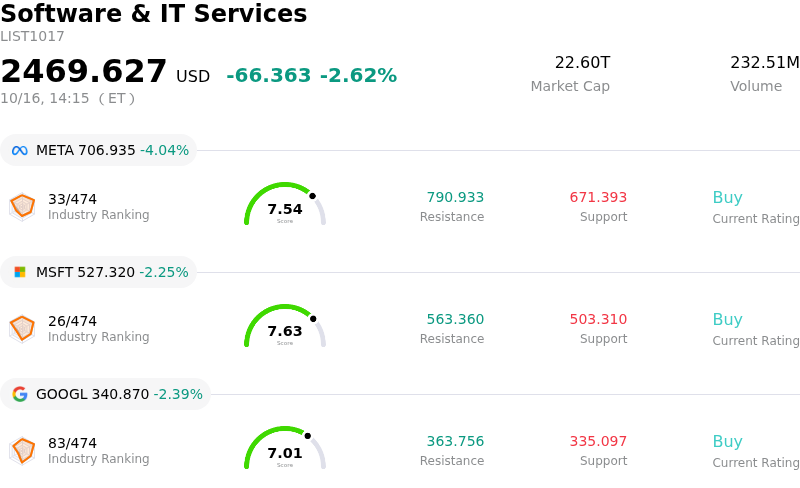
Netflix Inc (NFLX) moved down by 3.28%. The Software & IT Services sector is down by 2.62%. The company underperformed the industry. Top 3 stocks by turnover in the sector: Meta Platforms Inc (META) down 4.07%; Microsoft Corp (MSFT) down 2.23%; Alphabet Inc Class A (GOOGL) down 2.41%.
What is driving Netflix Inc (NFLX)’s stock price down today?
Netflix experienced downward pressure and heightened intraday volatility as investor sentiment was weighed down by major organizational shifts just days ahead of its upcoming third-quarter earnings release. The company announced a high-profile leadership transition within its content division, replacing its Chief Content Officer with former Disney executive Peter Rice. This shift closely follows the announcement of Netflix’s largest workforce reduction in several years, which eliminated roughly six percent of its workforce across technology, product, human resources, and legal units. While management emphasized that the restructuring is intended to maintain strict capital discipline and align operating expenses with growth, the abrupt timing of executive changes right before quarterly results raised concerns about content execution and strategic alignment.
Adding to the selling pressure, several Wall Street analysts trimmed their target prices for the stock, pointing to persistent headwinds in viewer engagement and subscriber metrics. Research reports highlighted softening usage trends in primary North American markets alongside intensifying competition from rival streaming services and short-form video platforms. Institutional focus has also shifted to content budget allocation efficiency, as investments in live sports and live event broadcasting account for a notable share of expenditure while driving a disproportionately small fraction of total viewing hours. These structural concerns have dampened expectations for near-term revenue acceleration.
The market decline also reflects pre-earnings position derisking, as traders exercise caution ahead of the company's detailed quarterly disclosure. With options pricing signaling expectations for significant post-earnings price volatility, investors opted to reduce exposure. The market is waiting for management to provide clarity on the performance of its ad-supported tier, the progression of operating margins, and the strategic direction under new content leadership before re-engaging.
Technical Analysis of Netflix Inc (NFLX)
Technically, Netflix Inc (NFLX) shows a MACD (12,26,9) value of 0.905, indicating a neutral signal. The RSI at 44.791 suggests neutral condition and the Williams %R at 43.109 suggests buy condition. Please monitor closely.
Media Coverage of Netflix Inc (NFLX)
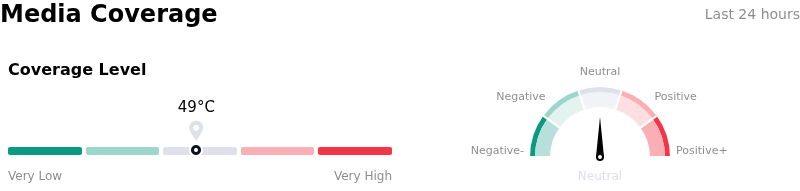
In terms of media coverage, Netflix Inc (NFLX) shows a coverage score of 49, indicating a moderate level of media attention. The overall market sentiment index is currently in neutral zone.
Fundamental Analysis of Netflix Inc (NFLX)
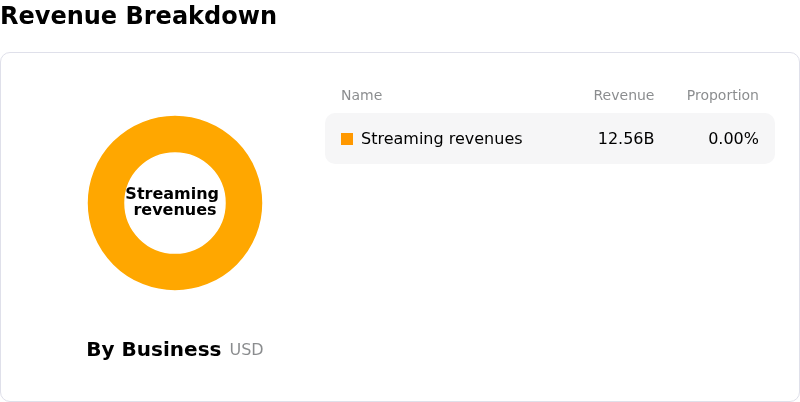
Netflix Inc (NFLX) is in the Software & IT Services industry. Its latest annual revenue is $45.18B, ranking 12 in the industry. The net profit is $10.98B, ranking 10 in the industry. Company Profile
Over the past month, multiple analysts have rated the company as Buy, with an average price target of $93.57, a high of $135.00, and a low of $57.00.
More details about Netflix Inc (NFLX)
Company Specific Risks:
- Surging U.S. Subscriber Churn and Declining Engagement: Third-quarter tracking data indicates domestic subscriber churn escalated sharply to 16.6% from previous levels around 5%, alongside a drop in average daily user viewing time to 73.2 minutes and notable engagement drop-offs among younger demographics.
- Analyst Downgrades and Weakening Originals Slate: Wall Street firms, including Wells Fargo and HSBC, issued ratings downgrades and price target cuts, citing a projected 21% year-over-year decline in top-100 original programming viewing hours for late 2026 and a drop in U.S. television market share to a multi-year low of 7.8%.
- Workforce Reductions Amid Growth Moderation: Management's execution of corporate layoffs eliminating approximately 1,000 positions—representing roughly 6% of global headcount across tech, product, and legal units—underscores internal operational friction and mounting pressure to protect margins as top-line revenue expansion decelerates.
- Margin Compression from High Content and Live Sports Commitments: Expanding financial commitments toward expensive live sports broadcasting rights and original content investment face diminishing returns, as total viewing-hour growth slowed to just 2% in the first half of the year.
Recommended Articles


