


Shopify Inc Stock (SHOP) Moved Down by 3.83% on Oct 16: What Signal Does It Send?
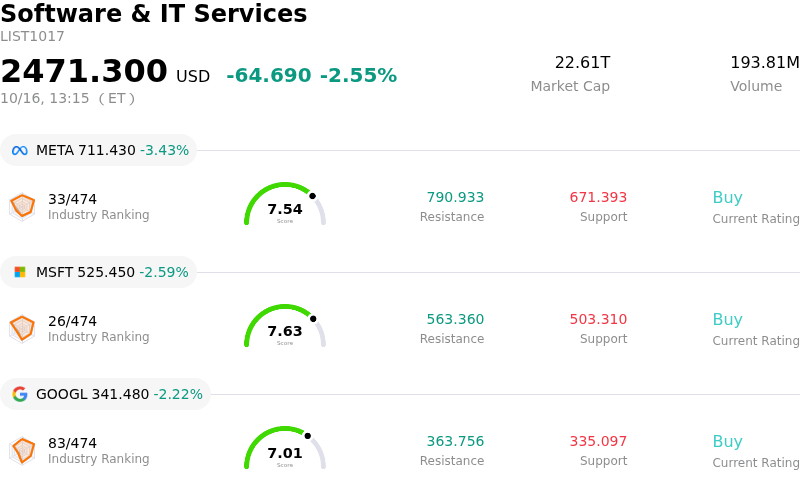
Shopify Inc (SHOP) moved down by 3.83%. The Software & IT Services sector is down by 2.55%. The company underperformed the industry. Top 3 stocks by turnover in the sector: Meta Platforms Inc (META) down 3.38%; Microsoft Corp (MSFT) down 2.59%; Alphabet Inc Class A (GOOGL) down 2.19%.
What is driving Shopify Inc (SHOP)’s stock price down today?
Shopify experienced downward intraday pressure as investors engaged in profit-taking following a strong multi-week rally that pushed the stock near its 52-week highs. After extended upside driven by market enthusiasm around AI-assisted commerce partnerships and recent analyst price target upgrades from major sell-side firms, the stock faced a natural consolidation phase. High-valuation software equities encountered broader market turbulence, prompting momentum-oriented traders to lock in recent capital gains ahead of the company's scheduled third-quarter financial results.
Fundamentally, the pullback reflects tension between robust top-line momentum and elevated valuation multiples. While investment banks including RBC Capital Markets and JPMorgan recently boosted their price targets to reflect optimism surrounding price increases and AI agent integrations, the stock's rich price-to-earnings and free-cash-flow multiples leave limited room for execution missteps. Institutional portfolio managers noted that while revenue growth remains durable above thirty percent, rapid expansion in lower-margin merchant payments relative to high-margin subscription software continues to keep gross margin trajectories under close scrutiny.
Looking ahead, market sentiment on Shopify remains focused on the upcoming earnings report to validate whether accelerating gross merchandise volume can sustain current valuation levels. The key catalysts for long-term re-rating include merchant adoption of AI checkout tools, international enterprise wins, and free cash flow margin performance. However, in the near term, high multiple technology stocks remain sensitive to broader sector rotation, interest rate expectations, and macro consumer spending dynamics, leading to heightened intraday price swings.
Technical Analysis of Shopify Inc (SHOP)
Technically, Shopify Inc (SHOP) shows a MACD (12,26,9) value of 3.602, indicating a buy signal. The RSI at 64.224 suggests neutral condition and the Williams %R at 21.456 suggests buy condition. Please monitor closely.
Fundamental Analysis of Shopify Inc (SHOP)
Shopify Inc (SHOP) is in the Software & IT Services industry. Its latest annual revenue is $11.56B, ranking 32 in the industry. The net profit is $1.23B, ranking 40 in the industry. Company Profile
Over the past month, multiple analysts have rated the company as Buy, with an average price target of $175.28, a high of $220.00, and a low of $120.00.
More details about Shopify Inc (SHOP)
Company Specific Risks:
- Stretched Valuation Premium and Technical Profit-Taking: Following a multi-week rally approaching its 52-week high of $182.19 and a forward P/E ratio exceeding 85x, recent analyst downgrades emphasize overbought technical conditions that leave the stock highly vulnerable to institutional profit-taking and sharp intraday pullbacks.
- Gross Margin Compression from Revenue Mix Shift: A continuous mix shift toward lower-margin Merchant Solutions (such as Shopify Payments) over high-margin Subscription Solutions, compounded by rising transaction processing losses and elevated AI infrastructure spending, continues to compress gross margins.
- Asymmetric Q3 Earnings and Guidance Execution Risk: With Wall Street consensus demanding over 31% year-over-year revenue growth to $3.74 billion for the upcoming Q3 earnings report, the company's valuation leaves zero margin for error regarding Gross Merchandise Volume (GMV) metrics or forward holiday quarter guidance.
- Disruption Vulnerability from Third-Party AI Shopping Agents: Architectural shifts toward third-party conversational AI interfaces and agentic commerce threaten to bypass merchant storefront discovery, raising ongoing institutional concerns over potential disintermediation of Shopify's direct checkout and monetization stack.
Recommended Articles


