


Applied Materials Inc Stock (AMAT) Moved Down by 3.13% on Oct 16: What Investors Need To Know
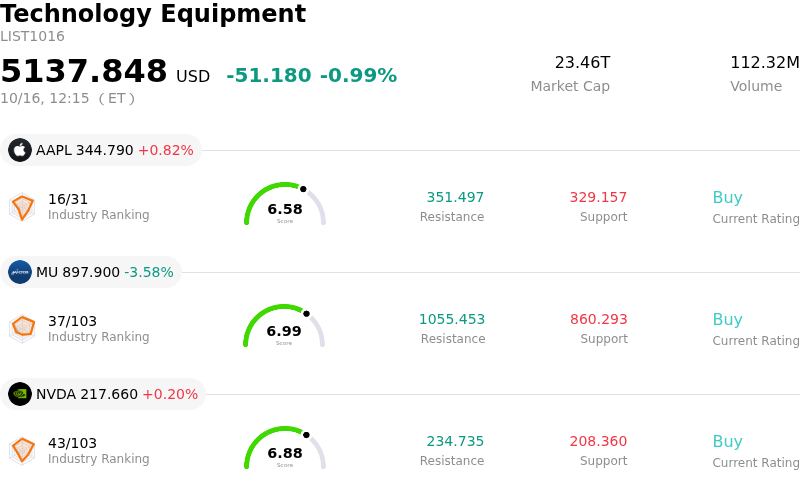
Applied Materials Inc (AMAT) moved down by 3.13%. The Technology Equipment sector is down by 0.99%. The company underperformed the industry. Top 3 stocks by turnover in the sector: Apple Inc (AAPL) up 0.67%; Micron Technology Inc (MU) down 3.65%; NVIDIA Corp (NVDA) up 0.12%.
What is driving Applied Materials Inc (AMAT)’s stock price down today?
Applied Materials experienced noticeable downward pressure and intraday volatility as broader semiconductor sector profit-taking continued to weigh on chipmaking equipment suppliers. A primary catalyst behind the recent weakness stems from investor disappointment following the company's investor day presentation at SEMICON West. Although management expressed optimism regarding long-term artificial intelligence infrastructure demand and highlighted long-term growth initiatives, the company refrained from offering specific near-term wafer fabrication equipment spending estimates. This omission heightened market concerns regarding potential delays in customer capital expenditure, factory space readiness, and supply chain timelines.
Valuation dynamics and profit-taking have further compounded the stock's downside pressure. After benefiting from a substantial rally earlier in the year propelled by AI-driven optimism, the semiconductor capital equipment group has become particularly vulnerable to tactical reallocations. Elevated valuation multiples relative to historical averages, combined with persistent insider selling over recent quarters, have prompted institutional investors to lock in gains across the equipment subsector.
Broader sector headwinds and policy uncertainties also continue to overhang the company. With China representing a significant portion of overall revenue, ongoing geopolitical trade tensions and export compliance considerations remain active risk factors. Furthermore, macro concerns surrounding global electronics demand and the capital budget timing of major foundry and memory customers have spilled over into peer equipment manufacturers, leading to broader industry-wide valuation adjustments.
Looking ahead, market focus will shift to the company's upcoming quarterly financial report. Investors will be seeking detailed operational clarity regarding order backlogs, revenue recognition timelines, and capacity expansion schedules. While long-term materials engineering opportunities tied to advanced packaging and AI chip architectures remain intact, short-term stock performance is likely to stay volatile until clear visibility on capital spending recovery materializes.
Technical Analysis of Applied Materials Inc (AMAT)
Technically, Applied Materials Inc (AMAT) shows a MACD (12,26,9) value of -21.559, indicating a neutral signal. The RSI at 30.492 suggests neutral condition and the Williams %R at 98.317 suggests oversold condition. Please monitor closely.
Media Coverage of Applied Materials Inc (AMAT)
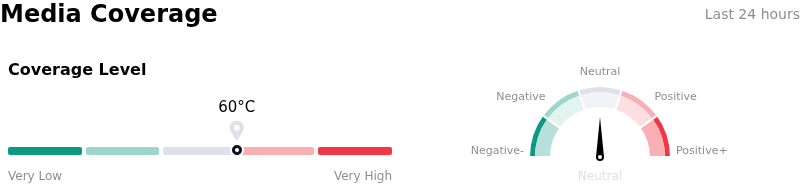
In terms of media coverage, Applied Materials Inc (AMAT) shows a coverage score of 60, indicating a moderate level of media attention. The overall market sentiment index is currently in neutral zone.
Fundamental Analysis of Applied Materials Inc (AMAT)
Applied Materials Inc (AMAT) is in the Technology Equipment industry. Its latest annual revenue is $28.37B, ranking 11 in the industry. The net profit is $7.00B, ranking 8 in the industry. Company Profile
Over the past month, multiple analysts have rated the company as Buy, with an average price target of $627.75, a high of $900.00, and a low of $308.00.
More details about Applied Materials Inc (AMAT)
Company Specific Risks:
- Omission of Near-Term Equipment Guidance: Management declined to provide a concrete near-term Wafer Fabrication Equipment spending forecast at its SEMICON West presentation, citing cleanroom space shortages, supply chain lead times, and energy infrastructure constraints, which raised doubts among investors regarding the timing of upcoming machine orders.
- Wall Street Price Target Reductions: Analysts at Evercore ISI and Needham issued price target cuts, with Evercore lowering its target from $700 to $590, highlighting that the stock's elevated valuation multiple leaves minimal margin for execution errors or near-term margin friction.
- Wafer Fab Equipment Market Share Loss: Institutional sentiment has been dampened by data showing AMAT's share of the overall Wafer Fabrication Equipment market contracted from 20.0% in 2024 to an estimated 17.9% in 2025, threatening management's long-term market share expansion targets.
- Geopolitical and Trade Restriction Headwinds: Ongoing U.S. export controls and trade limits on advanced semiconductor equipment shipments to China continue to impair revenue visibility in a geography that historically accounted for a significant portion of overall sales.
Recommended Articles


