


WTI Futures (USOIL-F) Is down 2.00% on Oct 16: Here Is Why
WTI Futures (USOIL-F) is down 2.00% at Oct 16 02:00(ET), now at $95.55, with a 7-day up of 4.34%.
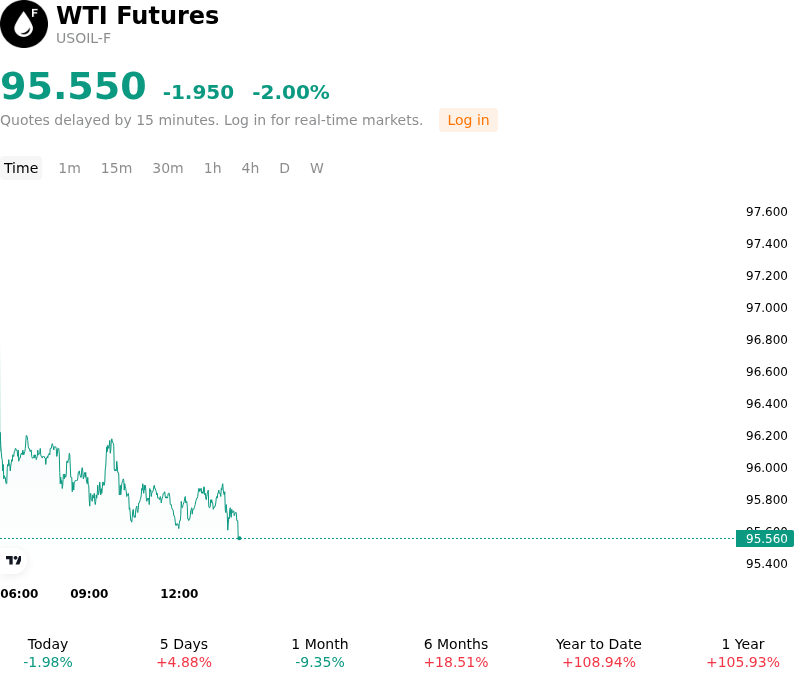
What is driving WTI Futures (USOIL-F)’s stock price down today?
WTI crude oil futures experienced downward pressure as market focus shifted toward potential policy interventions aimed at easing global supply transport costs and mitigating energy price inflation. Reports indicating that US authorities are evaluating measures to relax restrictions on shadow fleet oil tankers provided immediate relief to shipping bottlenecks and elevated freight rates. By expanding the effective pool of commercial vessels available for international crude transport, market participants priced in reduced logistics friction and lower delivered costs, effectively unwinding a portion of the geopolitical risk premium that had previously supported prices.
The pullback was further reinforced by macroeconomic headwinds and monetary policy expectations weighing on global energy demand forecasts. A firmer US dollar raised the relative purchasing cost of dollar-denominated oil futures for non-US buyers, constraining physical demand appetite across major import hubs. Additionally, ongoing releases of strategic petroleum reserves by international energy bodies continued to bolster short-term commercial supply availability, buffering market balances despite recent drawdowns in domestic inventory metrics.
From a structural perspective, the intraday decline reflects an event-driven repricing rather than a fundamental breakdown in baseline supply dynamics. While near-term policy adjustments and currency strength created immediate downside momentum, underlying physical market tightness and potential disruptions in key maritime transit routes remain critical balance variables. Institutional investors continue to monitor OPEC+ production policy compliance, non-OPEC output trajectories, and overall refinery intake rates to determine whether current price levels signal a durable consolidation or a temporary pause in broader market volatility.
Technical Analysis of WTI Futures (USOIL-F)
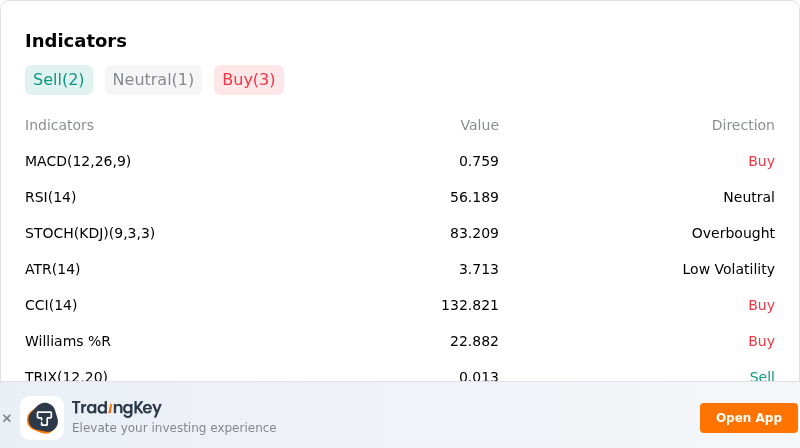
Technically, WTI Futures (USOIL-F) shows a MACD (12,26,9) value of 0.759, indicating a buy signal. The RSI at 56.189 suggests neutral condition and the Williams %R at 22.882 suggests buy condition. Please monitor closely.
More details about WTI Futures (USOIL-F)
Recent Events and Risks:
- Accelerated Coordinated Strategic Reserve Releases: The International Energy Agency agreed to accelerate the release of 100 million barrels of crude and petroleum products from member stockpiles, injecting substantial physical volumes into the market and threatening to suppress futures prices.
- Proposed US Policy Relief on Tanker Sanctions: Policy updates indicating that US officials are considering easing sanctions on shadow fleet oil tankers have created downside volatility, as increased available vessel capacity threatens to lower global shipping freight premiums for crude oil.
- Refined Product Stock Builds and Cushing Inventory Growth: Weekly EIA data revealed an unexpected 3.5 million-barrel build in US gasoline inventories alongside a 1.86 million-barrel stock increase at the Cushing delivery hub, signaling underlying softness in consumer refined product demand.
- Surging Saudi Production and Global Demand Deterioration: Official reports showing Saudi Arabian crude output surging by 2 million barrels per day, combined with recent agency cuts to global demand growth forecasts, heighten downside risk of structural oversupply once near-term transport bottlenecks ease.
Recommended Articles


