


Brent (UKOIL) Is down by 2.12% on Oct 15: Is the Demand Outlook Changing?
Brent (UKOIL) is down 2.12% at Oct 15 03:25(ET), now at $102.13, with a 7-day down of 0.57%.
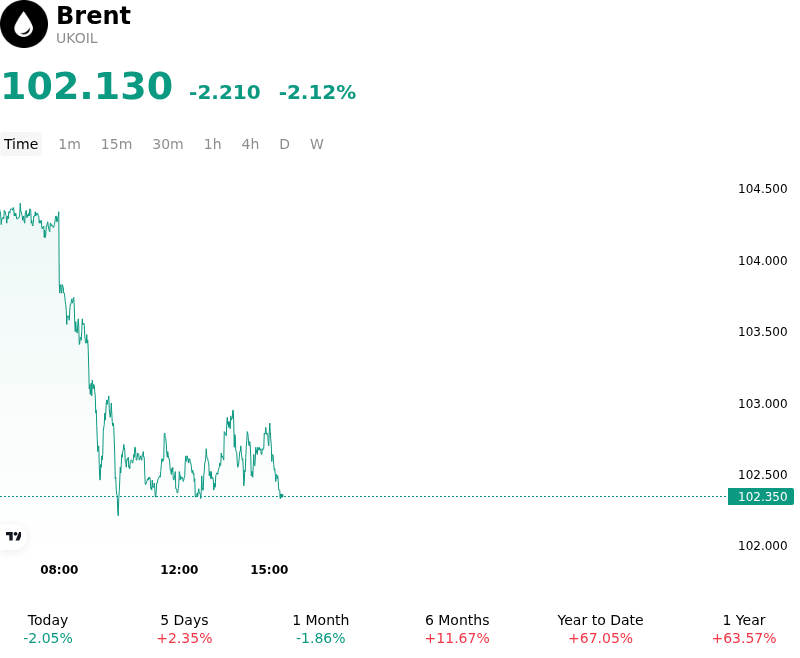
What is driving Brent (UKOIL)’s stock price down today?
The pullback in Brent crude futures was primarily driven by a repricing of near-term supply risks as policy discussions focused on mitigating global shipping bottlenecks. Market sentiment turned cautious following reports that US authorities were evaluating measures to reduce maritime transport costs by potentially easing sanctions on international tanker fleets. This development raised expectations of improved physical crude availability on water, counteracting recent concerns over shipping disruptions in key transit corridors. Additionally, data indicating a gradual recovery in Middle Eastern crude export flows provided a tangible buffer to global supply balance expectations, leading traders to unwind a portion of the geopolitical risk premium embedded in front-month contracts.
Institutional positioning also played a decisive role in the downward momentum. After a period of elevated pricing, bullish momentum showed clear signs of buyer exhaustion. Market participants largely shrugged off underlying inventory draws in commercial crude stockpiles, interpreting the muted price reaction as a signal that near-term upside had been fully priced in. The failure of bullish inventory data to catalyze further gains prompted systematic funds and institutional investors to lock in profits and reduce gross long exposure.
From a structural perspective, the movement reflects a tactical repricing rather than a fundamental resolution of supply constraints. Global oil balances remain sensitive to potential transport logistics disruptions, elevated freight rates, and refined product market tightness. However, unless fresh supply interruptions materialize or Asian refinery intake accelerates significantly, near-term price gains are likely to remain constrained by expanding supply availability and macro-driven demand headwinds. Investors continue to monitor energy transit security, official selling price adjustments from major exporters, and central bank policy trajectories for further directional cues.
Technical Analysis of Brent (UKOIL)
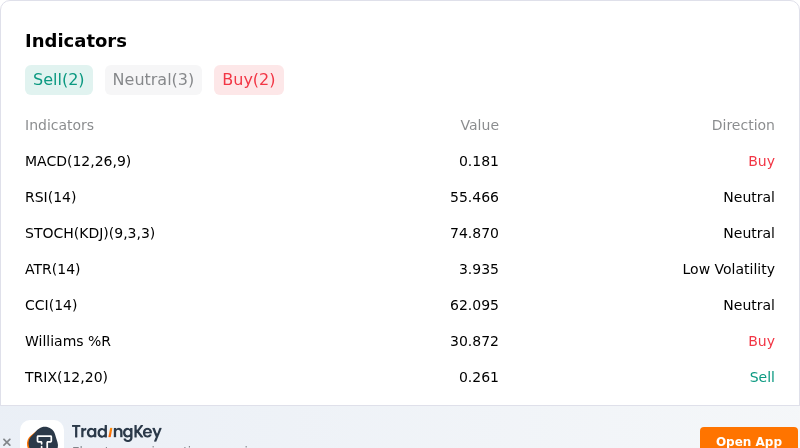
Technically, Brent (UKOIL) shows a MACD (12,26,9) value of 0.181, indicating a buy signal. The RSI at 55.466 suggests neutral condition and the Williams %R at 30.872 suggests buy condition. Please monitor closely.
More details about Brent (UKOIL)
Recent Events and Risks:
- U.S. Policy Proposals to Ease Shipping Sanctions: The U.S. administration announced considerations to relax sanctions on shadow-fleet crude tankers transporting oil from sanctioned nations, aiming to lower record freight costs and potentially stripping out a significant portion of the geopolitical risk premium in Brent futures.
- Rebound in Middle East and Russian Export Volumes: International Energy Agency (IEA) updates revealed Middle East Gulf crude exports bounced back to approximately 75% of pre-war levels alongside a 65,000 barrel-per-day increase in Russian output, alleviating immediate physical market deficit fears.
- Speculative Position Unwinding in ICE Brent Contracts: Institutional money managers and hedge funds have reduced net-long bets on ICE Brent futures, triggering intraday liquidation and profit-taking that caps overhead price advances.
- Price Fatigue Despite Bullish Inventory Data: Brent prices failed to sustain momentum above $106 per barrel and fell over 1% despite an 11.1 million barrel drawdown in U.S. crude inventories reported by the API, pointing to buyer exhaustion and downside vulnerability to macro headwinds.
Recommended Articles


