


Robinhood Markets Inc Stock (HOOD) Moved Down by 3.06% on Sep 30: Facts Behind the Movement
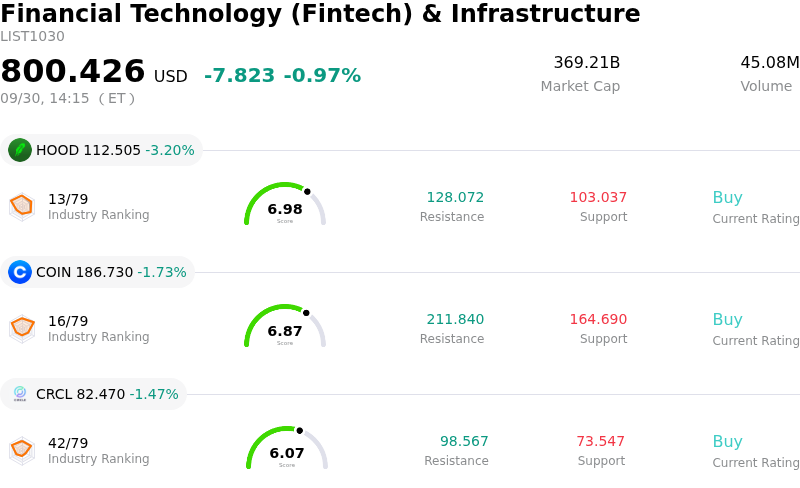
Robinhood Markets Inc (HOOD) moved down by 3.06%. The Financial Technology (Fintech) & Infrastructure sector is down by 0.97%. The company underperformed the industry. Top 3 stocks by turnover in the sector: Robinhood Markets Inc (HOOD) down 3.20%; Coinbase Global Inc (COIN) down 1.73%; Circle Internet Group Inc (CRCL) down 1.47%.
What is driving Robinhood Markets Inc (HOOD)’s stock price down today?
Robinhood Markets experienced heightened intraday volatility, reversing early gains and closing lower despite a slate of major strategic product announcements at its annual HOOD Summit. Early session momentum was propelled by bullish headline news, including the introduction of AI-driven trading agents, perpetual futures, earnings prediction contracts, and expanded weekend equity trading. Several Wall Street brokerages reiterated positive ratings and raised price targets in response to strong preliminary third-quarter trading volume data. However, as the session progressed, buying momentum faded and gave way to classic sell-the-news profit-taking following a substantial run-up leading into the conference.
A primary driver behind the intraday downturn stems from valuation discipline and broader sector dynamics. With the stock trading near recent multi-month highs and commanding premium valuation multiples relative to historical averages and traditional brokerage peers, market participants capitalized on the event catalyst to lock in profits. Additionally, while broader equity indexes found support from favorable macroeconomic inflation data, financial services equities underperformed the wider market during the session. Recent disclosures detailing insider share sales under pre-arranged trading plans also contributed to cautious sentiment among institutional investors.
From an operational and institutional standpoint, Robinhood's core trading metrics remain healthy, underpinned by solid month-over-month volume trends across equity, options, and digital asset categories. The continuous rollout of trading products, artificial intelligence capabilities, and extended execution hours reinforces the platform's ability to deepen active trader engagement and drive transaction revenue. However, short-term price stability will depend on management's ability to execute on these ambitious product rollouts while proving that user growth and trading volume acceleration can sustain elevated valuation multiples heading into the upcoming quarterly financial results.
Technical Analysis of Robinhood Markets Inc (HOOD)
Technically, Robinhood Markets Inc (HOOD) shows a MACD (12,26,9) value of -1.667, indicating a neutral signal. The RSI at 49.327 suggests neutral condition and the Williams %R at 56.880 suggests sell condition. Please monitor closely.
Media Coverage of Robinhood Markets Inc (HOOD)
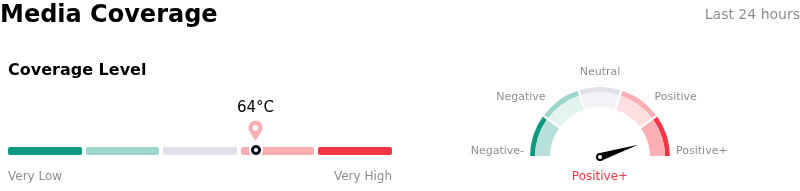
In terms of media coverage, Robinhood Markets Inc (HOOD) shows a coverage score of 64, indicating a high level of media attention. The overall market sentiment index is currently in extremely bullish zone.
Fundamental Analysis of Robinhood Markets Inc (HOOD)
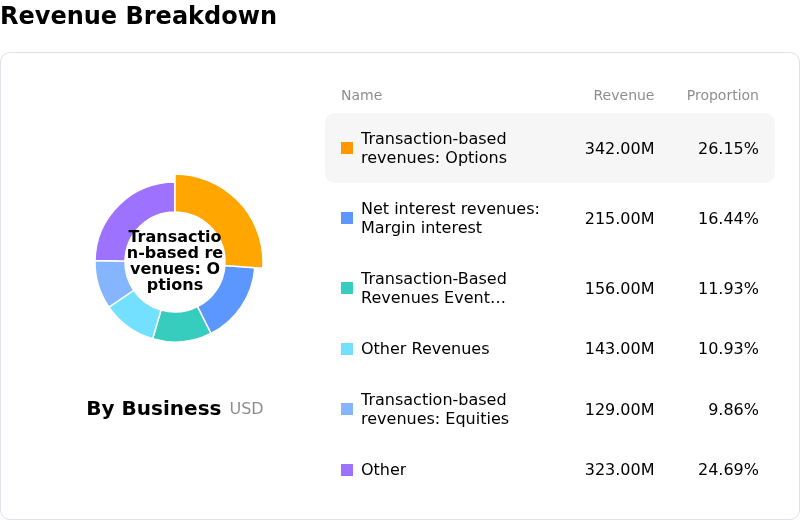
Robinhood Markets Inc (HOOD) is in the Financial Technology (Fintech) & Infrastructure industry. Its latest annual revenue is $4.47B, ranking 8 in the industry. The net profit is $1.88B, ranking 4 in the industry. Company Profile
Over the past month, multiple analysts have rated the company as Buy, with an average price target of $132.06, a high of $170.00, and a low of $55.04.
More details about Robinhood Markets Inc (HOOD)
Company Specific Risks:
- High-Leverage Crypto Derivatives Regulatory and Volatility Risk: Unveiled plans at the HOOD Summit to offer U.S. retail traders crypto perpetual futures with up to 10x leverage significantly heighten exposure to CFTC and SEC regulatory oversight, while increasing platform vulnerability to customer margin calls and liquidations during sudden crypto market drawdowns.
- DOJ Insider Trading Probe and Internal Control Weaknesses: Department of Justice criminal fraud charges against former Robinhood engineers for illegal front-running of crypto listing announcements have triggered reputational damage and heightened concerns over internal compliance controls and potential regulatory enforcement actions.
- Persistent Insider Share Liquidations: Multiple recent SEC Form 144 and Rule 10b5-1 filings by senior executives—including CEO Vladimir Tenev, CFO Shiv Verma, and co-founder trusts—reflect substantial ongoing share sales, creating equity supply overhead and signaling internal caution.
- Elevated Multiple Sensitivity to Cyclical Trading Spikes: Trading at a stretched Price-to-Sales ratio exceeding 21x leaves the stock highly susceptible to sharp downside repricing if retail crypto trading volumes soften or if pending regulatory approvals for expanded weekend equity trading encounter delays.
Recommended Articles


