
BNB (BNBUSD) Suddenly Goes down 1.22% on Sep 13: What's Driving This

Source Tradingkey

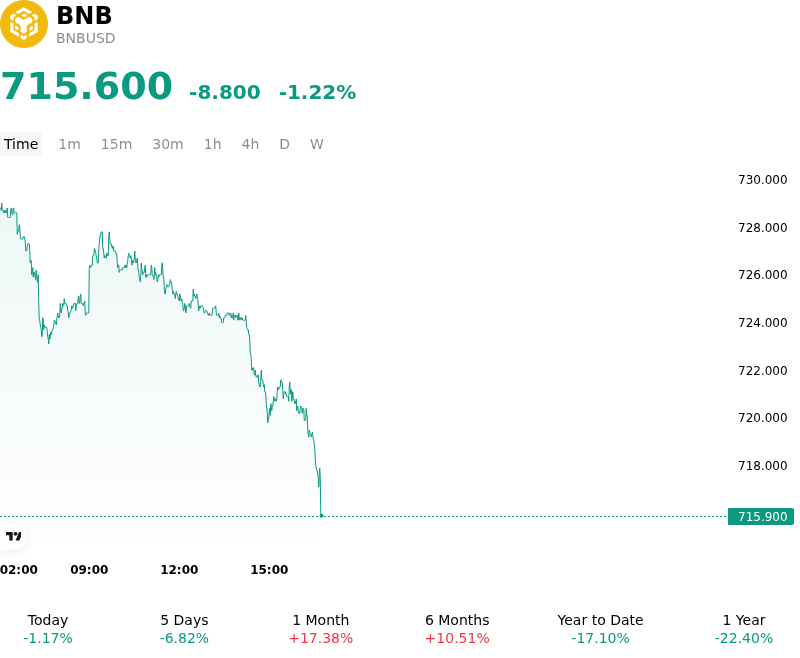
BNB (BNBUSD) is down 1.22% at Sep 13 04:45(ET), now at $715.6, with a 7-day down of 4.52%.
SummaryOverview

What is driving BNB (BNBUSD)’s stock price down today?

The decline in BNB reflected broader macro-driven caution across digital assets as investors recalibrated risk exposure ahead of key central bank policy decisions and absorbed recent inflation data. Fluctuating Treasury yield dynamics and lingering macro uncertainty weighed on broader risk appetite, leading market participants to trim exposure across top-tier layer-1 tokens. As major benchmarks consolidated in narrow trading bands, capital flows temporarily cooled, dampening immediate upside momentum across the altcoin sector.

From an asset-specific perspective, BNB experienced resistance near key technical supply zones and major psychological valuation thresholds. Following a multi-week recovery supported by network throughput improvements and elevated decentralized exchange volume, the token encountered short-term profit-taking from swing traders. In derivatives markets, open interest saw a modest contraction as leverage was reset following repeated rejections near local overhead resistance, driving a temporary rebalancing of speculative positioning.

Despite the intraday softness, underlying network metrics continue to highlight persistent ecosystem activity. BNB Chain has retained significant market share in on-chain trading volumes alongside expanding institutional participation in tokenized real-world assets. The price adjustment appears to represent a temporary, liquidity-driven consolidation within a broader range rather than a structural deterioration in fundamental demand. Institutional investors continue to monitor broader regulatory conditions surrounding centralized exchange ecosystems and global liquidity trajectories as key determinants for medium-term capital deployment.

Technical Analysis of BNB (BNBUSD)

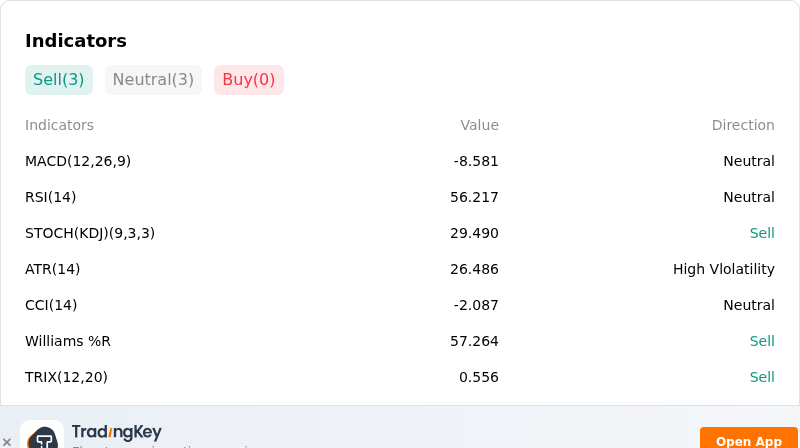
Technically, BNB (BNBUSD) shows a MACD (12,26,9) value of -8.619, indicating a neutral signal. The RSI at 56.121 suggests neutral condition and the Williams %R at 57.547 suggests sell condition. Please monitor closely.
IndicatorAnalysis

More details about BNB (BNBUSD)

Recent Events and Risks:

  • Macro Interest Rate Pressure and Broad Crypto Retraction: Recent U.S. inflation data and elevated Treasury yields have rekindled fears of prolonged high interest rates, triggering a market-wide risk-off rotation that pushed BNB down roughly 6% from its recent $757 high toward the critical $700 support level.
  • Leveraged Long De-leveraging and Liquidation Cascades: Overly concentrated long positioning in perpetual futures led to a sharp unwind, resulting in millions of dollars in forced long liquidations and a near 7% drop in open interest, which heightens the risk of cascading sell stops if prices break below $700.
  • On-Chain Supply Concentration and Whale Volatility: On-chain tracking highlights that top wallet entities and exchange-controlled vaults control over half of the circulating BNB supply, exposing the market to sudden liquidity shocks and steep intraday slippage if single large holders or vesting contracts move funds.
  • Regulatory Overhang and Regional Compliance Risk: Persistent international regulatory scrutiny regarding Binance operations and regional compliance frameworks (such as European MiCA authorization requirements) continue to generate headline risk that deters institutional dip-buyers during market pullbacks.
Disclaimer: For information purposes only. Past performance is not indicative of future results.
placeholder
Financial Markets 2026: Volatility Catalysts in Gold, Silver, Oil, and Blue-Chip Stocks—A CFD Trader's OutlookGet a comprehensive financial market 2026 outlook exploring key economic drivers, volatility catalysts in gold, oil and stocks, and what the evolving economic outlook means for cfd trading strategies and risk management on global markets.
Author  Rachel Weiss
May 15, Fri
Get a comprehensive financial market 2026 outlook exploring key economic drivers, volatility catalysts in gold, oil and stocks, and what the evolving economic outlook means for cfd trading strategies and risk management on global markets.
placeholder
Japanese Yen rallies to February 18 high as upbeat wage data and GDP lift BoJ hike betsThe USD/JPY pair declines for the second straight day – also marking the fourth day of a fall in the previous five – and sinks to its lowest level since February 18, around mid-153.00s during the Asian session on Tuesday.
Author  FXStreet
Sep 08, Tue
The USD/JPY pair declines for the second straight day – also marking the fourth day of a fall in the previous five – and sinks to its lowest level since February 18, around mid-153.00s during the Asian session on Tuesday.
placeholder
Brent holds above $100 as tanker attacks tighten supply — but four forces are capping the rallyBrent crude is holding above $100 a barrel for a second session, its first close above the level since late July, as tanker attacks near the Strait of Hormuz squeeze an already tight physical market. Yet the rally has been gradual: 8.3 mb/d of Gulf output is still shut in, diesel is at a record, and forecasts now range from $74 to $100.
Author  Irene Q.
Sep 10, Thu
Brent crude is holding above $100 a barrel for a second session, its first close above the level since late July, as tanker attacks near the Strait of Hormuz squeeze an already tight physical market. Yet the rally has been gradual: 8.3 mb/d of Gulf output is still shut in, diesel is at a record, and forecasts now range from $74 to $100.
placeholder
US August CPI lands tonight: after a 5.4% PPI shock, will the Fed hike on September 16?US August PPI came in at 5.4% year-on-year, above the 5.3% consensus, with core PPI at 4.6%. Traders have pushed the odds of a 25bp Fed hike on September 15-16 to around 70%. Tonight's CPI is the last major inflation print before the decision — here is the full calendar, the consensus numbers, and what a hot versus cool reading would mean for the dollar, yields, gold and stocks.
Author  Irene Q.
Sep 11, Fri
US August PPI came in at 5.4% year-on-year, above the 5.3% consensus, with core PPI at 4.6%. Traders have pushed the odds of a 25bp Fed hike on September 15-16 to around 70%. Tonight's CPI is the last major inflation print before the decision — here is the full calendar, the consensus numbers, and what a hot versus cool reading would mean for the dollar, yields, gold and stocks.
placeholder
Gold Price Forecast: PPI and Oil Prices Fuel Inflation Concerns, Can CPI Change Gold's Direction?As of the Asian session on September 11, gold prices (XAUUSD) remained in weak consolidation today after dropping sharply to near $4,300 on Thursday, with the latest price trading around
Author  TradingKey
Sep 11, Fri
As of the Asian session on September 11, gold prices (XAUUSD) remained in weak consolidation today after dropping sharply to near $4,300 on Thursday, with the latest price trading around
goTop
quote