


Wheat Futures (WHEAT-F) Is down 2.01% on Sep 2: What Changed in Supply and Demand?
Wheat Futures (WHEAT-F) is down 2.01% at Sep 2 01:35(ET), now at $765.65, with a 7-day up of 2.44%.
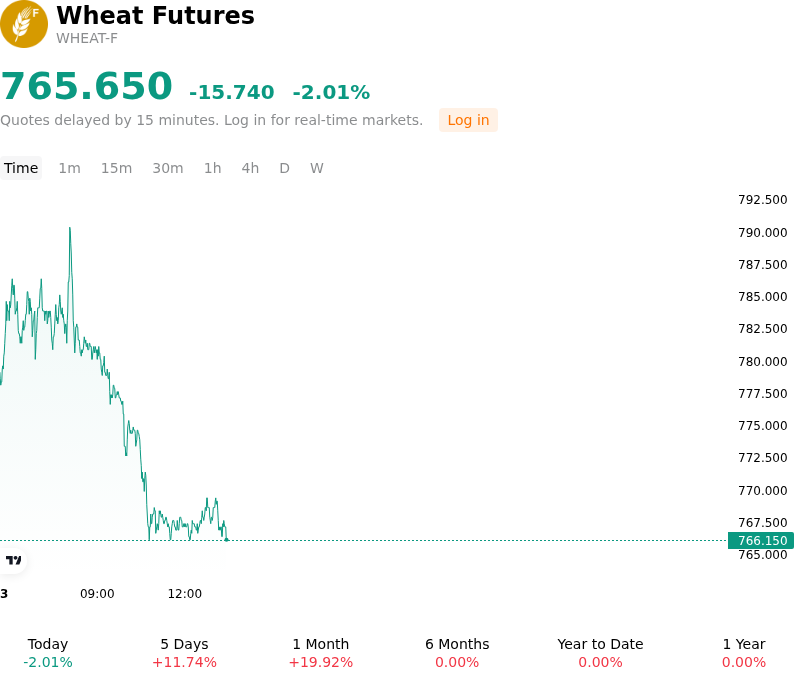
What is driving Wheat Futures (WHEAT-F)’s stock price down today?
Wheat futures faced downside pressure as market participants engaged in profit-taking following a substantial multi-week rally to multi-year highs. The primary catalyst for the pullback was renewed diplomatic headlines regarding Black Sea shipping routes. Reports that Turkey was actively pushing to broker a revived grain export initiative between Russia and Ukraine temporarily cooled acute supply disruption fears. Although market participants remain skeptical regarding the immediate feasibility of a formal corridor, the potential for stabilized Black Sea export flows prompted speculative traders to trim exposure and reduce the geopolitical risk premium embedded in global benchmark prices.
Fundamental developments further reinforced the softer price tone through seasonal supply expansion and sluggish export demand. In North America, the rapid pace of the spring wheat harvest, which progressed well ahead of five-year historical averages, steadily increased physical grain availability across elevators and transit channels. Concurrently, improved crop prospects in competing export origins, including upward production adjustments in Australia following beneficial rains, expanded the global supply outlook. On the demand side, U.S. origin wheat continues to struggle with international competitiveness. U.S. export inspections and cumulative marketing-year shipments remain significantly behind prior-year levels, as high domestic futures prices continue to priced out buyers relative to cheaper Russian cash offerings.
From a market structure perspective, the price concession represents an event-driven correction within a volatile broader environment rather than an immediate structural shift. Institutional positioning turned defensive as funds took profits following the steep August advance, while technical resistance near long-term highs triggered systematic long liquidation. Moving forward, investors remain focused on Black Sea port infrastructure integrity, actual shipping volumes, and upcoming government crop estimates. Unless a verified diplomatic arrangement substantially restores trade flows, underlying geopolitical friction and tight global ending stocks are likely to maintain a elevated baseline for market volatility.
Technical Analysis of Wheat Futures (WHEAT-F)
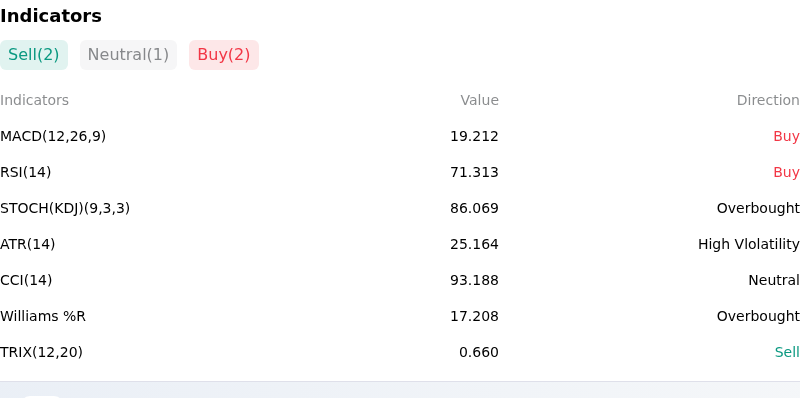
Technically, Wheat Futures (WHEAT-F) shows a MACD (12,26,9) value of 19.212, indicating a buy signal. The RSI at 71.313 suggests buy condition and the Williams %R at 17.208 suggests overbought condition. Please monitor closely.
More details about Wheat Futures (WHEAT-F)
Recent Events and Risks:
- Black Sea Safe-Passage Corridor Proposals: Diplomatic initiatives led by Türkiye to establish safe-passage shipping corridors in the Black Sea have triggered sudden pullbacks in wheat futures, as market participants rapidly strip out geopolitical war-risk premiums previously priced into short-term contracts.
- Accelerated Spring Wheat Harvest Pace: The U.S. spring wheat harvest reached 77% complete—significantly outpacing the five-year average pace of 68%—flooding spot delivery points with physical grain and intensifying seasonal pressure from producer selling and elevator hedging.
- Sluggish Export Pace and Passing Tenders: Official export inspection reports reveal year-to-date U.S. wheat shipments running 28.4% below last year's pace, compounded by key international buyers like Jordan passing on recent wheat tenders without awarding purchases, signaling persistent demand friction for higher-priced U.S. grain.
- Upward Crop Estimates from Competitor Exporters: Official forecasts from Australia's ABARES revised 2026/27 domestic wheat production upward by 3 million metric tons to 29.9 million metric tons following beneficial rainfall, while expanded export transit flows out of Central Asia reinforce global supply availability.
Recommended Articles


