


SAP SE Stock (SAP) Moved Down by 3.03% on Aug 12: Key Drivers Unveiled
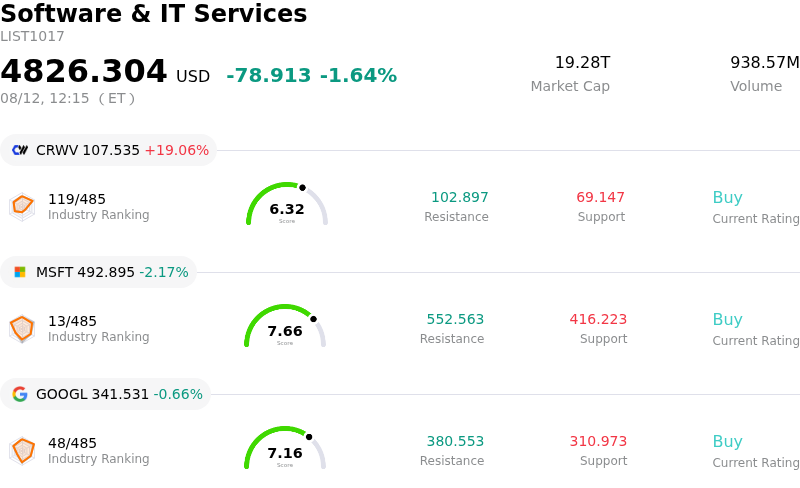
SAP SE (SAP) moved down by 3.03%. The Software & IT Services sector is down by 1.64%. The company underperformed the industry. Top 3 stocks by turnover in the sector: CoreWeave Inc (CRWV) up 19.06%; Microsoft Corp (MSFT) down 2.14%; Alphabet Inc Class A (GOOGL) down 0.66%.
What is driving SAP SE (SAP)’s stock price down today?
SAP experienced downward pressure and heightened intraday volatility driven by a combination of security patch concerns, profit-taking following a recent technical recovery, and lingering questions surrounding near-term operating margin dilution.
A primary catalyst for the market reaction was the public disclosure of a significant security release. SAP published an extensive security patch advisory covering dozens of vulnerabilities, including multiple critical-severity flaws across core enterprise solutions such as SAP Commerce Cloud and Manufacturing Integration and Intelligence. The high severity rating of these issues sparked immediate caution regarding system risk and potential operational disruption for corporate customers, negatively weighing on investor sentiment.
The sell-off was further amplified by technical profit-taking. In the weeks prior, the stock had staged a notable rebound, reclaiming key technical benchmarks including its 200-day moving average, buoyed by solid second-quarter cloud revenue figures and the activation of a multi-billion euro share buyback tranche. Having advanced into a resistance zone after that multi-session rally, traders utilized the security news and broader sector softness as an opportunity to lock in recent gains.
Fundamentally, investors remain focused on the company's profitability trajectory. While second-quarter cloud backlog acceleration and migration to the cloud suite signaled sustained demand, management recently adjusted its full-year operating profit outlook lower to account for acquisition integration costs related to software deals. The temporary margin dilution, alongside intensifying competition in enterprise artificial intelligence tools, has capped valuation multiples and left the stock particularly sensitive to negative short-term headlines.
Technical Analysis of SAP SE (SAP)
Technically, SAP SE (SAP) shows a MACD (12,26,9) value of 8.057, indicating a buy signal. The RSI at 76.494 suggests buy condition and the Williams %R at 2.714 suggests overbought condition. Please monitor closely.
Fundamental Analysis of SAP SE (SAP)
SAP SE (SAP) is in the Software & IT Services industry. Its latest annual revenue is $41.49B, ranking 14 in the industry. The net profit is $8.07B, ranking 13 in the industry. Company Profile
Over the past month, multiple analysts have rated the company as Buy, with an average price target of $253.74, a high of $367.98, and a low of $154.99.
More details about SAP SE (SAP)
Company Specific Risks:
- Cloud Backlog Deceleration and Guidance Cut: Recent financial updates indicated a deceleration in SAP's current cloud backlog growth alongside a reduction in full-year 2026 non-IFRS operating profit guidance to €11.8–€12.2 billion, signaling potential margin compression and softer recurring revenue momentum.
- Antitrust Regulatory Scrutiny: European Commission authorities initiated an antitrust investigation into SAP's Enterprise Resource Planning (ERP) maintenance and support policies, raising investor concerns over legal exposure, prospective regulatory fines, and mandatory alterations to high-margin service streams.
- Institutional Analyst Downgrades: Investment firms including JPMorgan downgraded SAP's stock and reduced price targets, citing a maturing cloud migration base, lowered Non-IFRS EBIT and EPS projections through 2028, and model volatility stemming from a shift toward outcome-based pricing.
- AI Monetization Hurdles and Market Competition: Growing skepticism around the tangible returns of SAP's generative AI tools, such as the Joule assistant, combined with aggressive market positioning by competing LLM providers and enterprise peers, poses execution risks and threatens client IT spending allocation.
Recommended Articles


