


Solana (SOLUSD) Is down 1.01% on Jul 31: Why It Happened
Solana (SOLUSD) is down 1.01% at Jul 31 00:50(ET), now at $72.75, with a 7-day down of 0.03%.
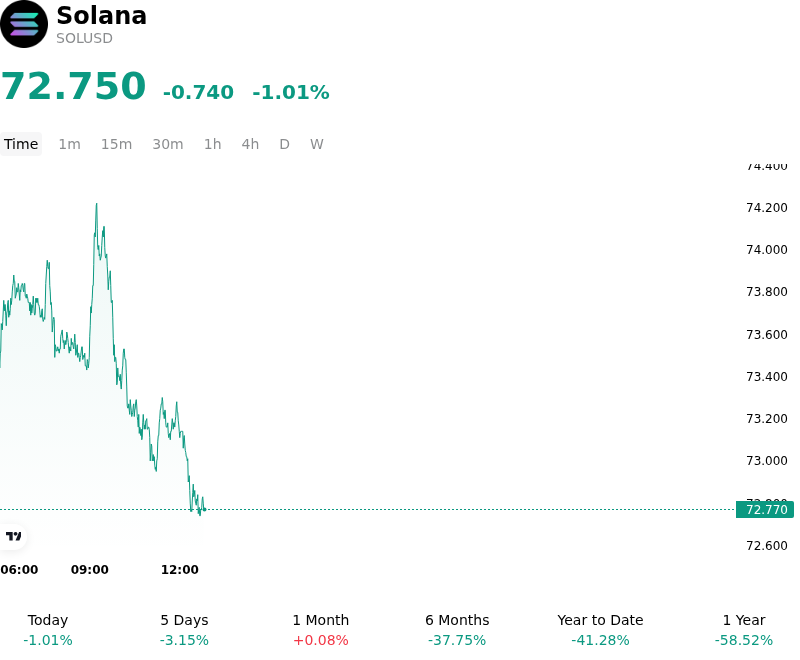
What is driving Solana (SOLUSD)’s stock price down today?
Solana experienced downward pressure as market participants recalibrated risk exposure following the latest Federal Reserve policy communication. The hawkish undertone from central bank officials, emphasizing a cautious approach to interest rate reductions amid persistent service-sector inflation, led to a tightening of global dollar liquidity. As a high-beta asset within the digital asset class, Solana is particularly sensitive to shifts in the discount rate and broader risk-off sentiment in global equity markets, which weighed on the token’s valuation throughout the session.
Institutional capital flows also showed signs of exhaustion. Data from spot Solana exchange-traded products indicated a transition from net inflows to modest outflows, suggesting that professional allocators are locking in gains following a period of sustained network outperformance. This shift in institutional positioning reflects a broader cautiousness as the market awaits more clarity on the regulatory framework for decentralized finance applications, which remain a core component of the Solana ecosystem's value proposition.
On-chain metrics contributed to the dampened sentiment. While network throughput remained robust, a slight deceleration in new address growth and a dip in decentralized exchange trading volumes compared to the previous month suggested a temporary cooling in retail engagement. Furthermore, the derivatives market saw a meaningful spike in long liquidations during the intraday volatility, which exacerbated the downward move. High open interest in perpetual futures had created a localized imbalance, and the subsequent flushing of leveraged positions provided the necessary liquidity for short-term sellers to dominate the order book.
Despite the immediate price correction, the structural narrative for the network remains centered on its scaling capabilities and growing footprint in the institutional payments sector. However, for the current period, the combination of macroeconomic headwinds, institutional profit-taking, and a technical shakeout in the derivatives market has shifted the immediate bias toward consolidation. Investors are now closely monitoring the stability of the network’s total value locked and the impact of upcoming protocol upgrades on transaction fee structures to gauge the next leg of the cycle.
Technical Analysis of Solana (SOLUSD)
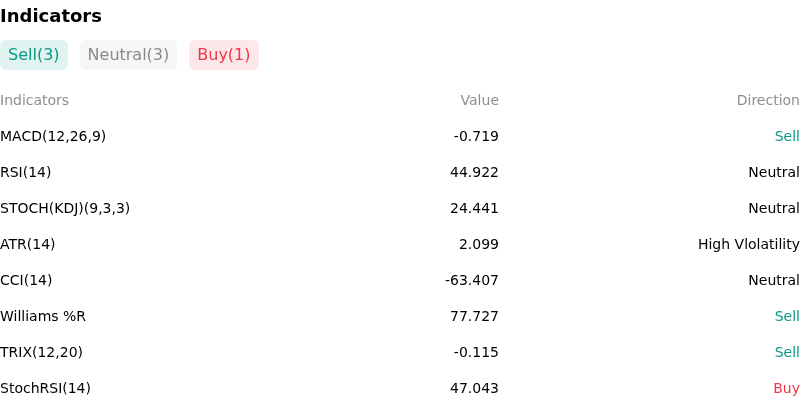
Technically, Solana (SOLUSD) shows a MACD (12,26,9) value of -0.719, indicating a sell signal. The RSI at 44.922 suggests neutral condition and the Williams %R at 77.727 suggests sell condition. Please monitor closely.
More details about Solana (SOLUSD)
Recent Events and Risks:
- ETF Approval Skepticism: Following recent spot Solana ETF filings, institutional analysts have highlighted the lack of a regulated CME futures market as a significant barrier to SEC approval, leading to a cooling of speculative sentiment and potential "sell the news" price action.
- FTX Estate Supply Overhang: On-chain data continues to track periodic transfers of SOL from FTX/Alameda-linked cold wallets to centralized exchanges for liquidation, maintaining a persistent supply overhead that threatens to dampen any short-term price recovery.
- Regulatory Litigation Risk: The SEC's ongoing classification of SOL as an unregistered security in active lawsuits against major crypto exchanges remains a primary downside risk, creating long-term uncertainty regarding its availability on US-regulated trading platforms.
- Leverage Liquidation Clusters: Market structure analysis reveals a high concentration of long-position liquidations clustered just below the $135 support level; a breach of this technical threshold could trigger an automated cascade of selling, increasing intraday volatility.
Recommended Articles


