


Solana (SOLUSD) Volatility Intensified on Jul 25: What You Should Know
Solana (SOLUSD) is up 1.09% at Jul 25 13:35(ET), now at $73.56, with a 7-day down of 1.22%.
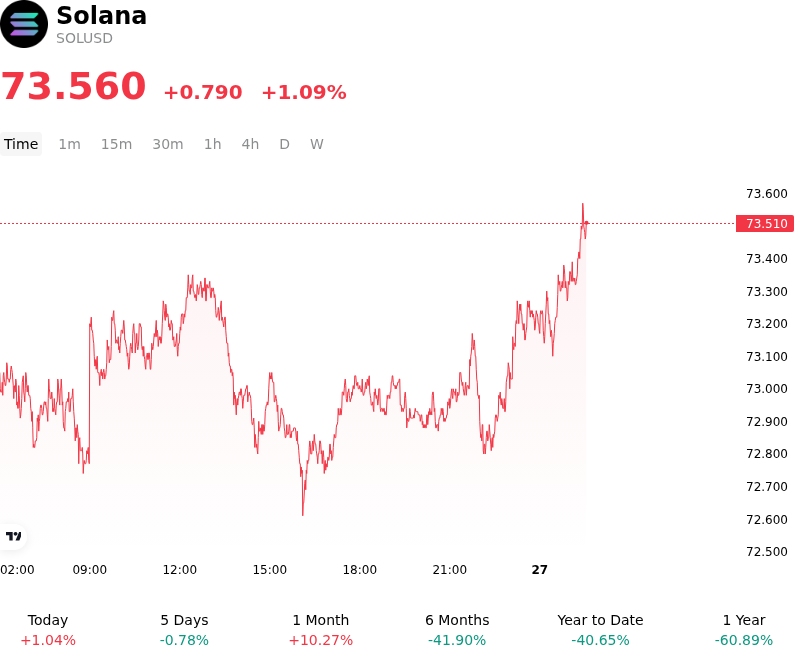
What is driving Solana (SOLUSD)’s stock price up today?
Solana's recent price appreciation reflects a strategic rotation into high-beta Layer-1 assets, driven by stabilizing global liquidity and a moderation in US Treasury yields. As the broader macroeconomic environment shifts toward a more favorable risk-on stance, institutional investors are increasingly prioritizing ecosystems with demonstrated throughput and real-world utility. This capital inflow is largely concentrated in assets that exhibit strong network effects and significant developer activity, positioning Solana as a primary beneficiary of diversified digital asset allocations.
Institutional demand remains a critical catalyst, particularly as market participants monitor the scaling of Solana-integrated financial products. The expansion of regulated investment vehicles and the increasing inclusion of the asset in multi-token institutional funds have provided a structural tailwind for price discovery. Market sentiment is further bolstered by the network's dominant role in stablecoin settlement and decentralized physical infrastructure projects, which continue to attract capital seeking exposure to blockchain applications beyond simple value storage.
On-chain dynamics reveal a surge in active addresses and transaction volumes, suggesting that the current move is supported by fundamental network usage rather than purely speculative interest. The successful deployment of core infrastructure upgrades has significantly improved network reliability, addressing previous concerns regarding uptime and enhancing the asset's appeal to large-scale enterprise partners. This technical maturity, combined with the integration of major payment networks, reinforces the narrative of the ecosystem as a viable competitor for traditional financial rails.
In the derivatives market, significant intraday volatility was likely triggered by the liquidation of contrarian positions as the asset breached key resistance levels. This movement was amplified by a buildup of long-biased open interest in perpetual contracts, reflecting a shift in trader positioning toward a more aggressive growth outlook. While the current momentum is positive, the market remains sensitive to shifts in Federal Reserve rhetoric and the potential for regulatory developments that could impact the classification and distribution of decentralized protocol tokens.
Investors continue to weigh the benefits of high network performance against the risks of market concentration and leverage-induced volatility. The interplay between institutional spot accumulation and speculative derivatives activity suggests a complex liquidity environment where sudden shifts in risk appetite can lead to rapid price adjustments. Despite these risks, the overarching trend points toward a deepening of liquidity and a more mature participant base as the ecosystem matures into a central pillar of the digital asset economy.
Technical Analysis of Solana (SOLUSD)
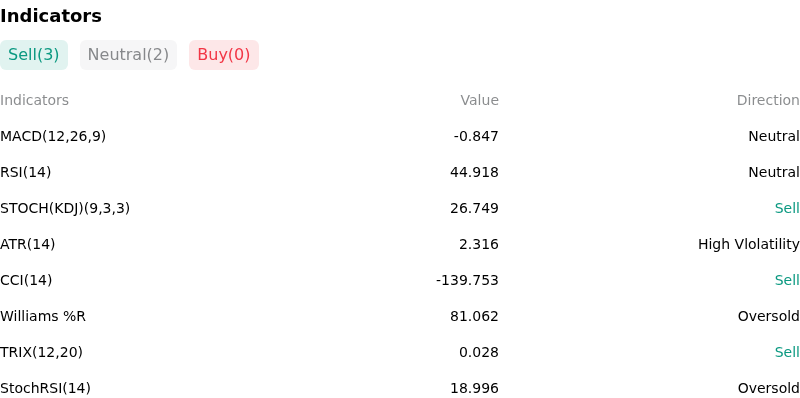
Technically, Solana (SOLUSD) shows a MACD (12,26,9) value of -0.847, indicating a neutral signal. The RSI at 44.918 suggests neutral condition and the Williams %R at 81.062 suggests oversold condition. Please monitor closely.
More details about Solana (SOLUSD)
Recent Events and Risks:
- Regulatory Disparity and ETF Exclusion: While Ethereum has seen significant progress toward spot ETF approval in the last 48 hours, the SEC’s ongoing classification of SOL as an unregistered security in lawsuits against major exchanges creates a widening regulatory gap, heightening the risk of institutional capital rotation out of the Solana ecosystem.
- Leverage Liquidation Clusters: Recent intraday price action has identified a high concentration of leveraged long positions near the $165–$170 support zone; a sustained break below this level could trigger a significant liquidation cascade, exacerbated by a 15% drop in 24-hour trading volume which limits market absorption capacity.
- Ecosystem Capital Flight: On-chain metrics indicate a cooling of the "memecoin" speculative cycle on the Solana network, leading to a 20% decline in active daily addresses over the last 72 hours and reducing the organic demand for SOL used for gas fees and decentralized exchange liquidity.
- Network Operational Fragility: Despite recent upgrades, market participants remain concerned about potential network congestion and increased transaction failure rates during periods of extreme volatility, which poses an operational risk for traders attempting to manage collateral or exit positions during rapid downside moves.
Recommended Articles


