


Solana (SOLUSD) Is down 1.02% on Jul 24: Key Drivers to Watch
Solana (SOLUSD) is down 1.02% at Jul 24 07:10(ET), now at $74.35, with a 7-day up of 0.32%.
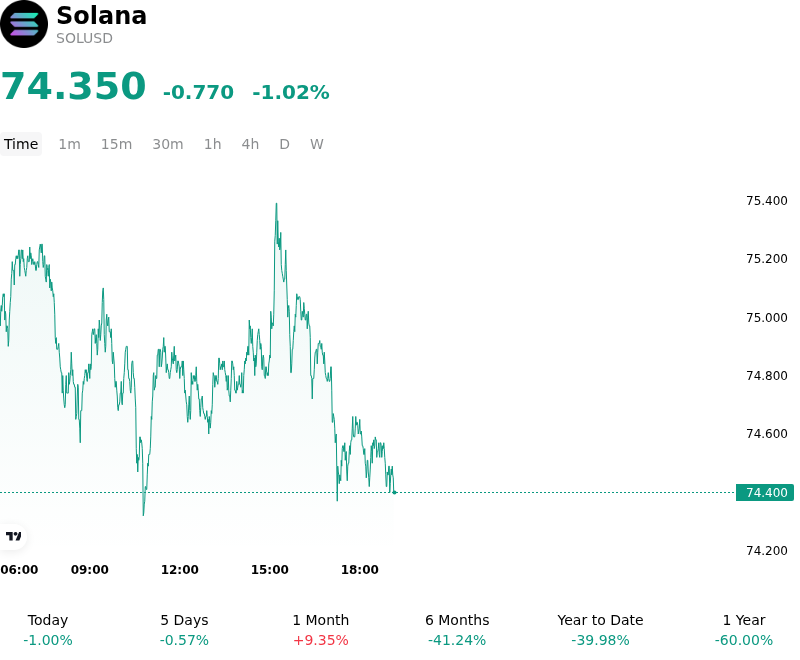
What is driving Solana (SOLUSD)’s stock price down today?
Solana’s recent price action reflects a broader consolidation within the digital asset market as institutional investors recalibrate their risk exposure following a shift in global liquidity expectations. The intraday volatility was primarily catalyzed by a strengthening US dollar and a slight uptick in Treasury yields, which pressured high-beta assets. For Solana, which has increasingly become a proxy for risk-on sentiment within the Layer-1 sector, these macro headwinds triggered a tactical reduction in positioning among algorithmic desks and institutional participants.
The softening of spot Solana ETF inflows has also played a critical role in tempering short-term momentum. After a period of consistent capital entry, a brief pause in net positive flows suggested that the market had reached a temporary equilibrium. Institutional desks appear to be moving into a wait-and-see stance ahead of upcoming economic data releases, leading to a thinning of the order books. This lower liquidity environment exacerbated the impact of sell-side pressure, resulting in the observed volatility as the market searched for a stable floor.
From an on-chain perspective, a notable increase in profit-taking among large-scale holders and validators was evident. This activity coincided with a flushing out of over-leveraged long positions in the perpetual futures market. As Solana’s funding rates had remained elevated prior to the session, the modest price correction triggered a series of cascading liquidations, intensifying the downward pressure. Despite the network’s robust performance and continued growth in daily active addresses, these technical factors dominated the immediate price action.
Furthermore, market sentiment was dampened by renewed regulatory focus on specific decentralized finance protocols within the Solana ecosystem. While not a direct challenge to the underlying blockchain, the heightened scrutiny on liquidity providers and yield-generating platforms created a localized risk-off environment. Investors are monitoring these developments closely, as they could impact the velocity of capital within the ecosystem. The structural narrative for Solana remains anchored in its scalability and institutional adoption, yet the current volatility underscores the sensitivity of the asset to shifting liquidity conditions and regulatory headlines.
Technical Analysis of Solana (SOLUSD)
Technically, Solana (SOLUSD) shows a MACD (12,26,9) value of -0.518, indicating a neutral signal. The RSI at 46.866 suggests neutral condition and the Williams %R at 63.363 suggests sell condition. Please monitor closely.

More details about Solana (SOLUSD)
Recent Events and Risks:
- Heightened Long Liquidation Sensitivity: Following recent price appreciation, SOL perpetual funding rates have moved into overextended positive territory, creating a crowded long trade that is highly vulnerable to a sharp liquidation cascade if the price fails to maintain immediate support levels.
- Regulatory Uncertainty Regarding Spot ETF Filings: While multiple firms have filed for a spot Solana ETF, market participants remain concerned about the SEC's historical classification of SOL as a security in various enforcement actions, posing a significant risk of application rejection or prolonged legal delays.
- FTX/Alameda Estate Liquidation Pressure: On-chain monitoring continues to track periodic unstaking and transfers of large SOL tranches from wallets associated with the FTX and Alameda bankruptcy estates, representing a persistent source of non-discretionary sell-side pressure on centralized exchanges.
- Memecoin Ecosystem Exhaustion: A significant portion of Solana's recent network activity and transaction fees has been driven by speculative memecoin trading; a sudden decline in retail interest or a "blow-off top" in this sub-sector could lead to a rapid contraction in network utility and downward pressure on the SOL token.
Recommended Articles


