


Solana (SOLUSD) Suddenly Goes up 1.21% on Jul 18: What You Need to Watch
Solana (SOLUSD) is up 1.21% at Jul 18 22:35(ET), now at $75.37, with a 7-day down of 1.43%.
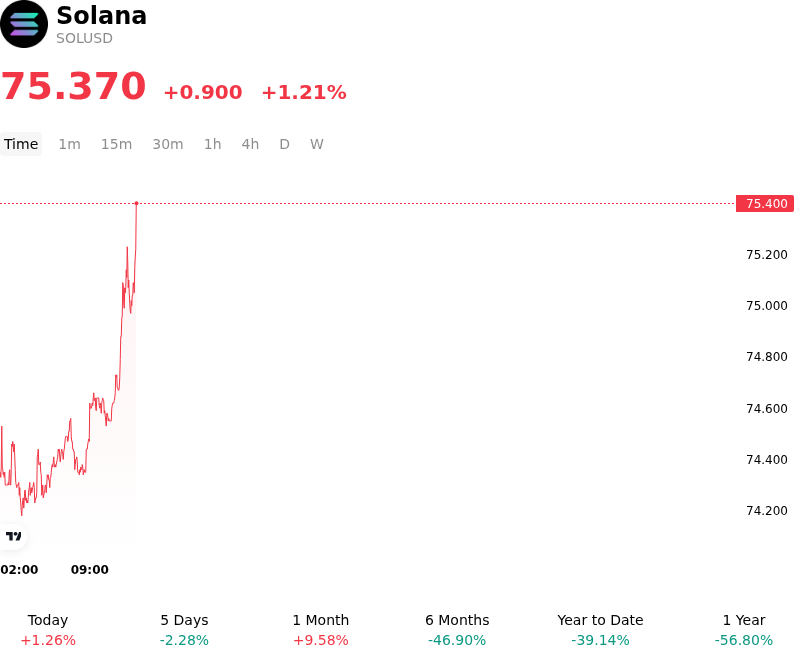
What is driving Solana (SOLUSD)’s stock price up today?
The advance in Solana reflects a continued expansion of institutional interest and a structural shift in Layer-1 dominance as market participants rebalance portfolios toward high-throughput ecosystems. The primary catalyst appears to be the sustained momentum from spot Solana ETF inflows throughout the preceding week, which has significantly tightened available exchange supply and established a higher floor for price discovery. Institutional allocators are increasingly viewing the network as the premier venue for capital-efficient decentralized finance and real-world asset tokenization, driving a steady accumulation trend that persists even during weekend trading sessions when traditional markets are closed.
On-chain metrics provide additional fundamental support for the current price appreciation, with decentralized exchange volumes and active address counts maintaining levels that challenge or exceed traditional competitors. The maturation of high-performance validator clients has substantially mitigated historical concerns regarding network stability and censorship resistance, reinforcing the narrative of Solana as a resilient, enterprise-grade blockchain. This technical de-risking has encouraged a new wave of corporate treasury adoption and stablecoin integration, further deepening the liquidity pool within the ecosystem and attracting long-term capital.
From a macro perspective, the current strength in digital assets is being supported by a softening of the US Dollar and a stabilization of Treasury yields, which has revitalized risk-on sentiment across the broader financial landscape. As global liquidity conditions show signs of easing, high-beta assets like Solana typically benefit from increased capital flows as investors seek outperformance relative to traditional benchmarks. This environment is particularly favorable for platforms that demonstrate clear utility and high velocity of capital, positioning the asset as a primary beneficiary of the current macro cycle.
Derivatives positioning also suggests a shift in market structure, with a notable reduction in short interest and a transition toward long-biased positioning in the perpetual swap markets. The absence of significant selling pressure, combined with positive funding rates, indicates that the current move is supported by spot demand rather than purely speculative leverage. Investors remain focused on upcoming regulatory clarity regarding staking rewards for exchange-traded products and the potential for further integration of the network into mainstream payment rails, which continue to act as long-term tailwinds for the asset.
Technical Analysis of Solana (SOLUSD)
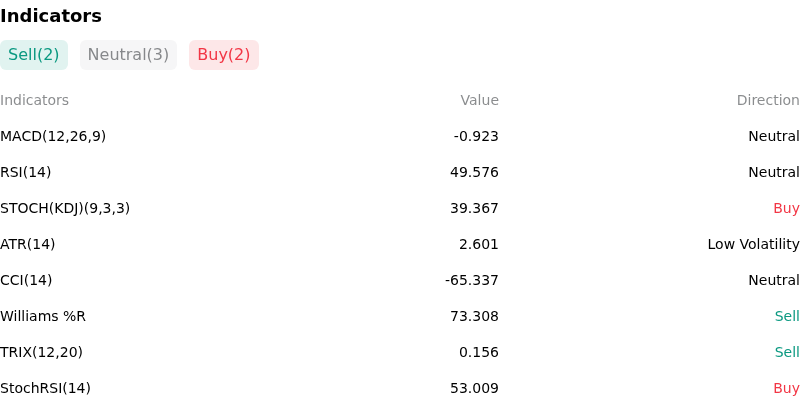
Technically, Solana (SOLUSD) shows a MACD (12,26,9) value of -0.923, indicating a neutral signal. The RSI at 49.576 suggests neutral condition and the Williams %R at 73.308 suggests sell condition. Please monitor closely.
More details about Solana (SOLUSD)
Recent Events and Risks:
- Regulatory Uncertainty and Security Classification: The SEC’s ongoing legal actions against major trading platforms continue to explicitly name SOL as an unregistered security, maintaining a significant regulatory hurdle that prevents the asset from following the same spot ETF path as Bitcoin or Ethereum and risking further delisting from US-based exchanges.
- FTX Estate Liquidation Pressure: Periodic transfers of large SOL tranches from wallets associated with the FTX estate to centralized exchanges continue to create a supply overhang, as the market anticipates systematic selling to satisfy creditor claims, often resulting in localized price suppression.
- Network Performance and Congestion Risks: Despite recent software patches, the Solana network remains susceptible to intermittent congestion and high transaction failure rates during periods of intense meme-coin trading or high-volume liquidations, which undermines institutional confidence in the protocol's long-term stability.
- Leverage Buildup and Liquidation Cascades: High levels of Open Interest in SOL perpetual futures, combined with fluctuating funding rates, indicate a heavily leveraged market structure that is prone to rapid deleveraging and long-squeeze events if the price breaks below key psychological support levels.
Recommended Articles


