


Bitcoin (BTCUSD) Is down 1.11% on Jul 17: What Do On-Chain Data and Market Sentiment Show?
Bitcoin (BTCUSD) is down 1.11% at Jul 17 00:25(ET), now at $63370.41, with a 7-day down of 0.69%.
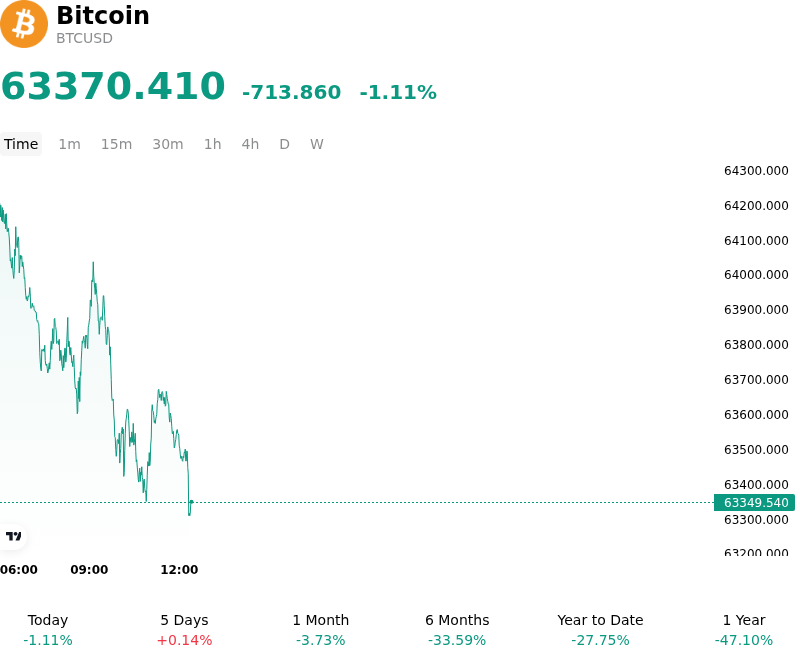
What is driving Bitcoin (BTCUSD)’s stock price down today?
Bitcoin's recent price action reflects a broader tightening of global liquidity conditions as market participants recalibrate expectations for the Federal Reserve's interest rate trajectory. Rising U.S. Treasury yields have exerted downward pressure on non-yielding assets, prompting a modest reduction in risk-on exposure across institutional portfolios. The uptick in the U.S. Dollar Index has further constrained capital flows into the digital asset space, as the opportunity cost of holding Bitcoin increases relative to traditional fixed-income instruments.
Institutional sentiment has cooled slightly as Spot Bitcoin ETF data indicates a decelerating pace of net inflows. After a period of aggressive accumulation, large-scale allocators appear to be adopting a more cautious stance, possibly waiting for clearer guidance on macroeconomic stability before committing additional capital. This pause in buy-side pressure from regulated vehicles has left the market more susceptible to localized selling and profit-taking by short-term holders who are sensitive to intraday volatility.
On-chain data and derivatives positioning suggest that the current retracement is being exacerbated by a slight flush of over-leveraged long positions. As spot prices moved toward key technical support levels, a series of liquidations in the perpetual futures market added momentum to the downside. This deleveraging process helps to reset the market's funding rates and clear out speculative excess, which often precedes a period of consolidation as the market seeks a new equilibrium.
Despite the immediate price volatility, the structural case for Bitcoin remains centered on its increasing integration into the global financial system and its role as a hedge against long-term fiscal instability. However, ongoing regulatory scrutiny and uncertainty surrounding the implementation of digital asset frameworks continue to serve as a persistent headwind. Investors remain focused on the interplay between regulatory clarity and institutional adoption, recognizing that while the long-term store-of-value narrative persists, the asset remains highly sensitive to shifts in the macro-financial environment and dollar liquidity.
Technical Analysis of Bitcoin (BTCUSD)
Technically, Bitcoin (BTCUSD) shows a MACD (12,26,9) value of 651.942, indicating a neutral signal. The RSI at 50.001 suggests neutral condition and the Williams %R at 48.162 suggests neutral condition. Please monitor closely.
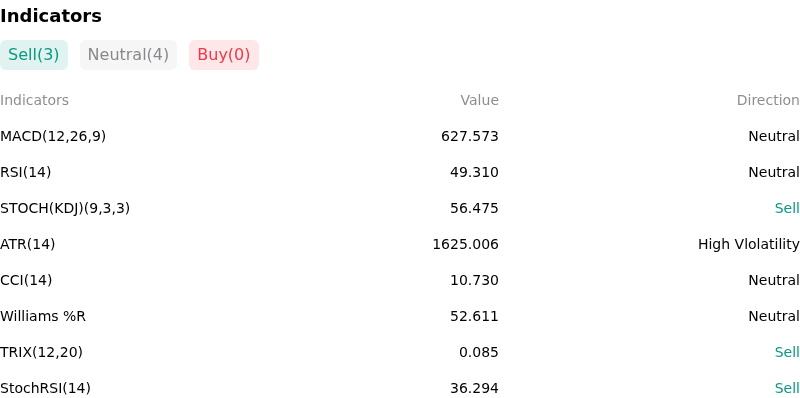
More details about Bitcoin (BTCUSD)
Recent Events and Risks:
- Hawkish Monetary Policy Signals: The release of the latest FOMC minutes indicated that Federal Reserve officials are increasingly frustrated by persistent inflation, with some members expressing a willingness to tighten policy further if necessary, which has dampened investor appetite for non-yielding assets like Bitcoin.
- Mt. Gox Creditor Repayment Overhang: On-chain monitoring has detected renewed activity in wallets associated with the defunct Mt. Gox exchange, intensifying fears that the distribution of approximately 142,000 BTC to creditors is nearing, which could introduce massive sell-side pressure to the spot market.
- Legislative and Executive Friction: Despite the U.S. House of Representatives passing the FIT21 crypto oversight bill, the White House’s formal statement of opposition has created a fresh wave of regulatory uncertainty, signaling that a favorable shift in the U.S. digital asset environment faces significant executive hurdles.
- Leverage Washout Vulnerability: Following Bitcoin's failure to maintain its recent push toward all-time highs, a build-up of leveraged long positions has created a "liquidation cluster" near the $68,000 support zone; a breach of this level could trigger a cascading sell-off as automated stop-losses are hit.
Recommended Articles


