

Honeywell International Inc Stock (HON) Moved Down by 3.39% on Jun 10: What Signal Does It Send?
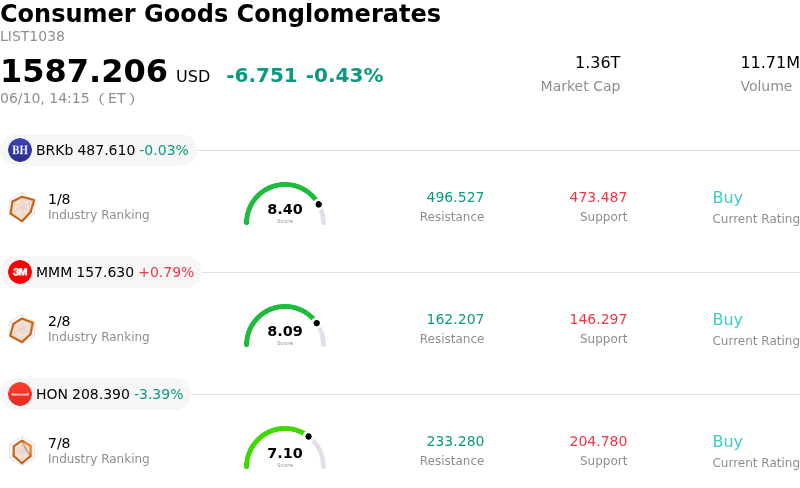
Honeywell International Inc (HON) moved down by 3.39%. The Consumer Goods Conglomerates sector is down by 0.43%. The company underperformed the industry. Top 3 stocks by turnover in the sector: Berkshire Hathaway Inc (BRKb) down 0.03%; 3M Co (MMM) up 0.79%; Honeywell International Inc (HON) down 3.39%.
What is driving Honeywell International Inc (HON)’s stock price down today?
Honeywell International's stock experienced a decline on the current trading day, likely driven by a combination of factors related to its imminent corporate restructuring and recent analyst adjustments. The company is in the process of spinning off its Aerospace division, which will become Honeywell Aerospace (HONA) and begin independent trading on June 29, 2026. The remaining entity will operate as Honeywell Technologies, retaining the ticker HON. This significant structural change is known to introduce short-term volatility as investors re-evaluate the standalone prospects of both businesses and institutional portfolios undergo adjustments.
On June 10, 2026, Barclays maintained its "Overweight" rating for Honeywell but lowered its price target from $251 to $239. While the rating remains positive, this reduction in the price target by an analyst could signal a more cautious outlook and contribute to a negative market reaction. The company had recently reaffirmed its full-year 2026 guidance for the combined entity. However, some reports noted that the midpoint of the adjusted earnings per share forecast for the combined company fell slightly below Wall Street consensus estimates, which may have also influenced investor sentiment.
The period leading up to the June 29 spin-off and a planned 1-for-2 reverse stock split for HON is characterized by market re-evaluation. Recent reports indicate that the stock has faced short-term downward pressure due to institutional selling, as large investors adjust their holdings in anticipation of the separation and the differing risk/reward profiles of the new entities. This portfolio rebalancing and the inherent complexities of such a large-scale corporate action often lead to temporary price fluctuations.
Technical Analysis of Honeywell International Inc (HON)
Technically, Honeywell International Inc (HON) shows a MACD (12,26,9) value of [1.03], indicating a neutral signal. The RSI at 42.51 suggests neutral condition and the Williams %R at -85.05 suggests oversold condition. Please monitor closely.
Media Coverage of Honeywell International Inc (HON)
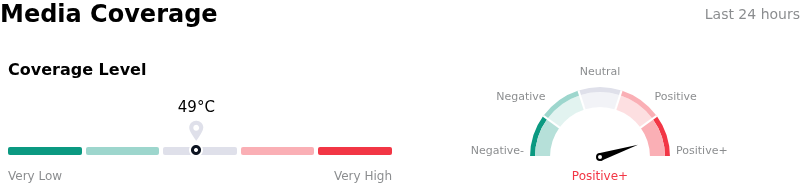
In terms of media coverage, Honeywell International Inc (HON) shows a coverage score of 49, indicating a moderate level of media attention. The overall market sentiment index is currently in extremely bullish zone.
Fundamental Analysis of Honeywell International Inc (HON)
Honeywell International Inc (HON) is in the Consumer Goods Conglomerates industry. Its latest annual revenue is $37.44B, ranking 3 in the industry. The net profit is $4.73B, ranking 3 in the industry. Company Profile
Over the past month, multiple analysts have rated the company as Buy, with an average price target of $0.00, a high of $0.00, and a low of $0.00.
More details about Honeywell International Inc (HON)
Company Specific Risks:
- Significant institutional selling has contributed to a short-term stock price decline of approximately 5% this week.
- The impending aerospace spin-off, coupled with a contingent 1-for-2 reverse stock split, creates substantial structural changes and potential share price volatility.
- The remaining Honeywell Technologies entity faces a sharply reduced revenue base, with its FY2026 revenue guided between $19.9 billion and $20.2 billion, compared to the prior consolidated base of roughly $39.3 billion.
- First-quarter FY2026 operating cash flow was negative, primarily due to increased payments related to spin-off initiatives and costs from settling Flexjet-related litigation.
Recommended Articles


