

Ferguson Enterprises Inc Stock (FERG) Moved Down by 3.03% on Jun 10: Key Drivers Unveiled
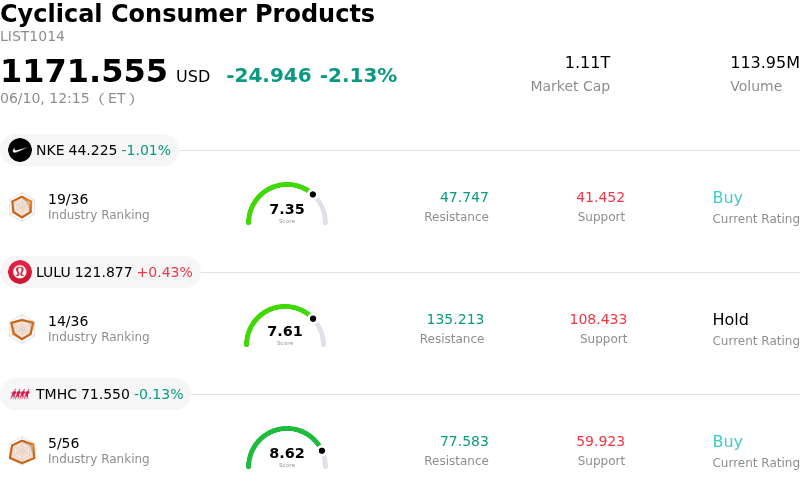
Ferguson Enterprises Inc (FERG) moved down by 3.03%. The Cyclical Consumer Products sector is down by 2.13%. The company underperformed the industry. Top 3 stocks by turnover in the sector: Nike Inc (NKE) down 1.01%; Lululemon Athletica Inc (LULU) up 0.43%; Taylor Morrison Home Corp (TMHC) down 0.13%.
What is driving Ferguson Enterprises Inc (FERG)’s stock price down today?
Ferguson plc (FERG) experienced a decline today, reflecting broader market dynamics or company-specific concerns. While exact intraday numerical values of the stock price fluctuations are not detailed, analysis of recent events provides context for potential downward pressure.
One factor that could be contributing to volatility is the company's exposure to the construction and renovation sectors. Although Ferguson has diversified demand across residential remodeling, large commercial construction, industrial processes, and infrastructure development, the residential market has shown signs of weakness. Investors are closely watching whether non-residential demand, particularly from large capital projects, can consistently offset this residential softness.
Furthermore, while Ferguson recently reported better-than-expected earnings for fiscal Q1 2026, with adjusted diluted EPS up and operating profit growth, revenue came in below analyst consensus. The mixed nature of these results, where profits exceeded expectations but revenue did not, could lead to investor uncertainty and contribute to a stock price dip, especially after previous positive movements based on solid operational performance.
Recent disclosures regarding Rule 10b5-1 trading plans by executives, including the CEO and CHRO, could also be a point of consideration for some investors. While these plans are standard and outline future stock sales under predetermined conditions, they sometimes attract attention and can influence short-term sentiment if misinterpreted as a lack of confidence, even if the first trading date is set for a later period.
Despite these potential headwinds, analysts generally maintain a positive outlook on FERG, with a consensus "Buy" rating and a median price target suggesting meaningful upside. However, the stock was noted to be trading at a premium to its intrinsic value, according to some assessments, which could make it more susceptible to price corrections if market conditions shift or if growth expectations are not fully met. The broader economic environment, including housing market activity and commercial construction trends, remains a key consideration for the company's future performance.
Technical Analysis of Ferguson Enterprises Inc (FERG)
Technically, Ferguson Enterprises Inc (FERG) shows a MACD (12,26,9) value of [-5.19], indicating a neutral signal. The RSI at 52.33 suggests neutral condition and the Williams %R at -0.38 suggests oversold condition. Please monitor closely.
Fundamental Analysis of Ferguson Enterprises Inc (FERG)
Ferguson Enterprises Inc (FERG) is in the Cyclical Consumer Products industry. Its latest annual revenue is $12.83B, ranking 6 in the industry. The net profit is $786.00M, ranking 8 in the industry. Company Profile
Over the past month, multiple analysts have rated the company as Buy, with an average price target of $282.75, a high of $315.00, and a low of $204.56.
More details about Ferguson Enterprises Inc (FERG)
Company Specific Risks:
- Ferguson plc is exposed to heightened intraday volatility stemming from its classification as a rate-sensitive industrial distributor, which makes its stock susceptible to market reactions to macroeconomic factors such as higher interest rates and inflation, as evidenced by recent pullbacks despite strong earnings.
- Technical analysis models indicate a potential for short-term downside, with an "exceptional risk-reward short setup" for FERG targeting an 8.2% decline, suggesting that technical trading patterns could trigger increased selling pressure and contribute to intraday price fluctuations.
- Multiple senior executives have recently entered Rule 10b5-1 trading plans, with provisions allowing the sale of up to 100% of net delivered shares from vested equity awards, which, despite being pre-scheduled, introduces a potential for increased selling volume and may contribute to negative market sentiment and intraday volatility.
- The stock has recently crossed below a key moving average level, a technical indicator often interpreted as a bearish signal by market participants, which could exacerbate selling pressure and contribute to current intraday volatility.
Recommended Articles


