


AMD and Nvidia Just Experienced an Unprecedented Valuation Split
Key Points
AMD's stock is valued at more than double Nvidia's.
Nvidia is more exposed to data center revenue.
- 10 stocks we like better than Nvidia ›
When two companies competing in the same industry have similar operating profiles, they tend to be priced about the same in terms of valuation. The market is full of examples like this: PepsiCo and Coca-Cola, Home Depot and Lowe's, Nvidia (NASDAQ: NVDA) and AMD (NASDAQ: AMD). However, the latter has experienced an unprecedented valuation split, and investors need to be aware of it.
Typically, there's one company that's more dominant than the other, and that company usually has a premium valuation. This is true for the stocks mentioned above, except for AMD and Nvidia. Despite Nvidia having a larger market share and growing faster than its peer, AMD is the more expensive stock. This is not a normal situation, and investors should be aware of it, as it should shape which of the stocks investors have higher exposure to.
Missed Nvidia in 2009? This Rare Signal Is Flashing Again. In 2009, a "Double Down" signal flashed for a little-known chipmaker called Nvidia. For the first time in years, that same "Total Conviction" signal is flashing for a company 1/100th the size of Nvidia. Continue »

Image source: Getty Images.
Why is AMD stock so expensive?
Both AMD and Nvidia are growing at an impressive rate; as a result, using a trailing earnings metric like the price-to-earnings (P/E) ratio doesn't paint the full picture of where these two stocks should actually be valued. However, there is a huge gap when trailing earnings are used.
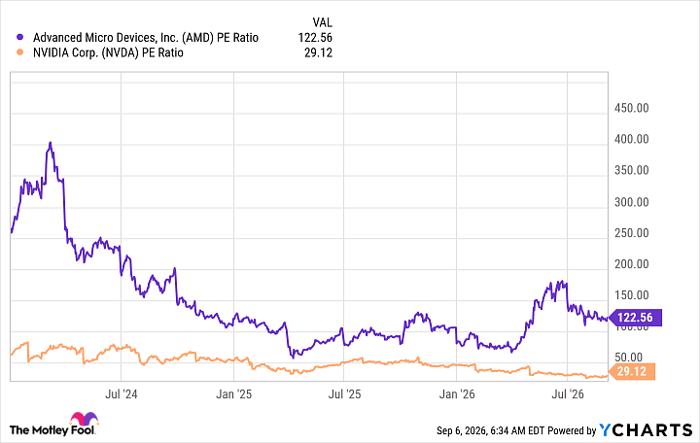
AMD PE Ratio data by YCharts
From this perspective, AMD has always been more expensive throughout the past few years as the AI arms race accelerated. However, AMD's earnings were heavily affected by profit margins that weren't optimal, thus the high valuation. AMD's margins are improving, but they're still nowhere close to Nvidia's, nor will they ever be.
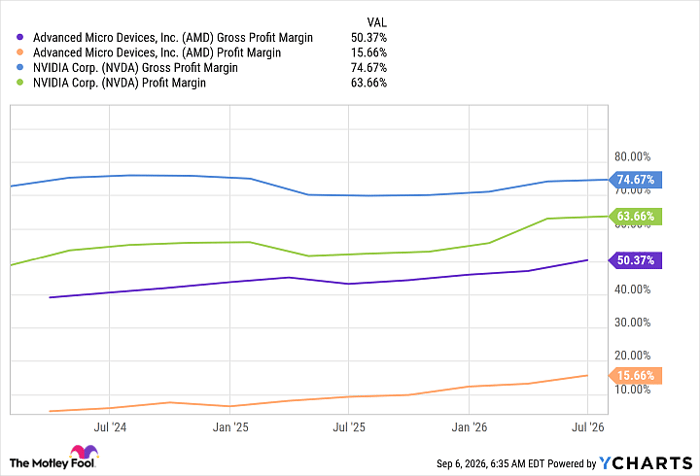
AMD Gross Profit Margin data by YCharts
Nvidia's profit margins -- which are after tax -- are actually higher than AMD's gross margins -- which are pretax. This is incredible considering these two are in a similar industry. However, when you look at the breakdown of these two businesses, it's clear that AMD will never match Nvidia's margins without a complete overhaul.
Nvidia is heavily focused on graphic processing units (GPUs) and the hardware that supports them, particularly in its data center division, which is benefiting significantly from the AI build-out. Nvidia products have been the industry standard from the beginning, and AMD hasn't been able to wrest away that leadership. In Q2, $89 billion of Nvidia's $96.2 billion total revenue came from its data center division. Because this segment is supply-constrained and Nvidia has the premium product, it can charge a higher price and make a ton of profit from these devices.
AMD has a different business. While it also has heavy exposure to data centers, that exposure is not nearly as high. In Q2, AMD's data center division generated $6.7 billion in revenue out of a total of $11.5 billion. That leaves its other divisions with a much higher share of total revenue, and these divisions don't have nearly as good an operating profile as Nvidia's data center business.
| Division | Revenue | Operating Income | Operating Margin |
|---|---|---|---|
| Data Center | $6.7 Billion | $2.1 Billion | 31% |
| Client & Gaming | $3.8 Billion | $582 Million | 15% |
| Embedded | $977 Million | $386 Million | 40% |
Data source: AMD.
Because so much of AMD's business comes from lower-margin Client & Gaming division, it will never be able to catch Nvidia's margins in its current form.
This should secure Nvidia's place as having a higher valuation than AMD, but it doesn't. And that is a signal for investors to sell AMD and buy Nvidia instead.
Nvidia's stock is cheap
If we use forward earnings, which include margin improvements and growth that AMD investors can expect, we see a stark contrast between the two that has only recently emerged.
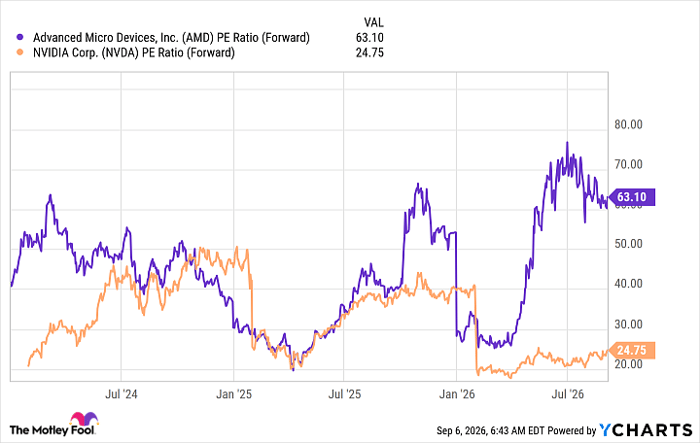
AMD PE Ratio (Forward) data by YCharts
When we utilize next fiscal year's projections, this difference is even more apparent.
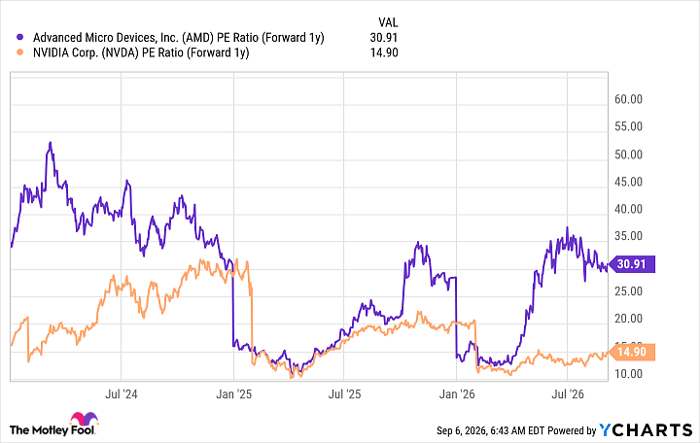
AMD PE Ratio (Forward 1y) data by YCharts
Nvidia is much cheaper than AMD while also being a better business. I think investors need to take advantage of this price mismatch and scoop up shares of Nvidia, as this deal won't last forever.
Should you buy stock in Nvidia right now?
Before you buy stock in Nvidia, consider this:
The Motley Fool Stock Advisor analyst team just identified what they believe are the 10 best stocks for investors to buy now… and Nvidia wasn’t one of them. The 10 stocks that made the cut could produce monster returns in the coming years.
Consider when Netflix made this list on December 17, 2004... if you invested $1,000 at the time of our recommendation, you’d have $421,997!* Or when Nvidia made this list on April 15, 2005... if you invested $1,000 at the time of our recommendation, you’d have $1,413,876!*
Now, it’s worth noting Stock Advisor’s total average return is 978% — a market-crushing outperformance compared to 213% for the S&P 500. Don't miss the latest top 10 list, available with Stock Advisor, and join an investing community built by individual investors for individual investors.
See the 10 stocks »
*Stock Advisor returns as of September 9, 2026.
Keithen Drury has positions in Nvidia. The Motley Fool has positions in and recommends Advanced Micro Devices, Home Depot, and Nvidia. The Motley Fool recommends Lowe's Companies. The Motley Fool has a disclosure policy.
Recommended Articles


