


Bitcoin Price Forecast: BTC recovery slows as cautious mood grows
- Bitcoin recovers slightly on Wednesday after falling over 2.4% over the previous two days.
- US-listed spot ETF recorded a mild outflow of $46.65 million on Tuesday amid escalating US-Iran tensions.
- Derivatives activity remains subdued, with relatively low leverage and sentiment gradually turning more defensive, signaling a cautious outlook.
Bitcoin (BTC) rebounds slightly, trading above $79,000 at the time of writing on Wednesday, having fallen over 2.4% over the previous two days. Institutional demand shows early signs of caution amid growing tensions in the Middle East, with spot Exchange Traded Funds recording mild outflows on Tuesday. Meanwhile, derivatives activity remains subdued, with traders gradually adopting a more hesitant stance toward the Crypto King.
Mild ETF outflows amid escalating US-Iran tensions
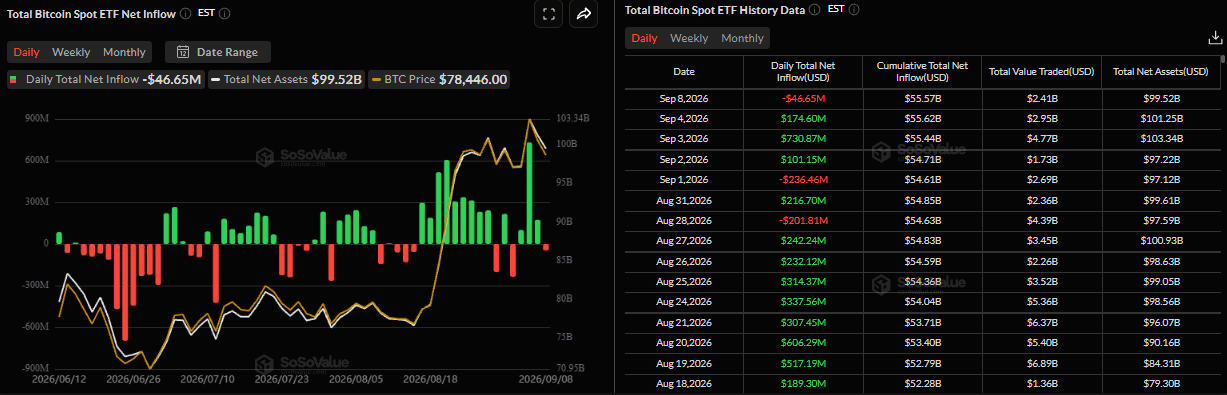
Institutional demand for Bitcoin shows early signs of caution so far this week. SoSoValue data showed the spot ETFs recorded a mild outflow of $45.65 million on Tuesday, breaking the three-day streak of inflows since last week. The outflow remains mild but also highlights investor caution amid escalating tensions in the Middle East.
In the latest development, the US forces struck five Iranian tankers on Tuesday, sinking one, in response to Tehran twice targeting an American warship. Four Iranian oil tankers in the Gulf of Oman linked to Iran’s Revolutionary Guards Corps (IRGC) were targeted, as well as another near Kharg Island, a major oil terminal off Iran’s coast, reported BBC.
These developments have widened the US-Iran confrontation and kept the geopolitical risk premium elevated, which could weigh on risk appetite and increase pressure on the Crypto King.
Bitcoin derivatives remain subdued as sentiment turns more guarded
A K33 Research report on Tuesday highlighted that BTC derivatives activity remains subdued across both the Chicago Mercantile Exchange (CME) and perpetual futures.
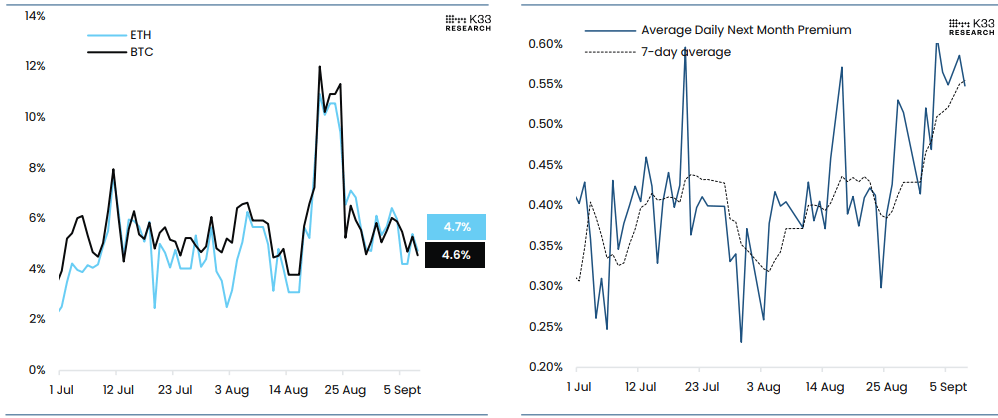
As shown in the chart below, BTC CME open interest has risen modestly, and contango has widened, with October trading at a 0.5% premium to September, the widest since December 2025, but annualized futures premiums remain below 5%, pointing to cautious positioning.
The analyst at K33 Research added, “Perpetual markets show a similar trend, with funding rates averaging 5.2% over the past week and briefly falling toward 0% over the weekend, while a short-lived rebound in open interest has fully reversed to around 320,000 BTC. Overall, leverage remains low, and sentiment is gradually turning more defensive.”
In addition to this defensive stance, as explained in the previous report, analysts believe BTC’s setup remains constructive but not yet conclusive, with Friday’s US inflation data still in focus.
Escalating tensions between the US and Iran are raising concerns about energy supplies and renewed inflationary pressures, potentially increasing the odds of the Federal Reserve’s (Fed) monetary policy tightening and weighing on BTC.
Bitcoin technical outlook: Consolidates above key EMAs
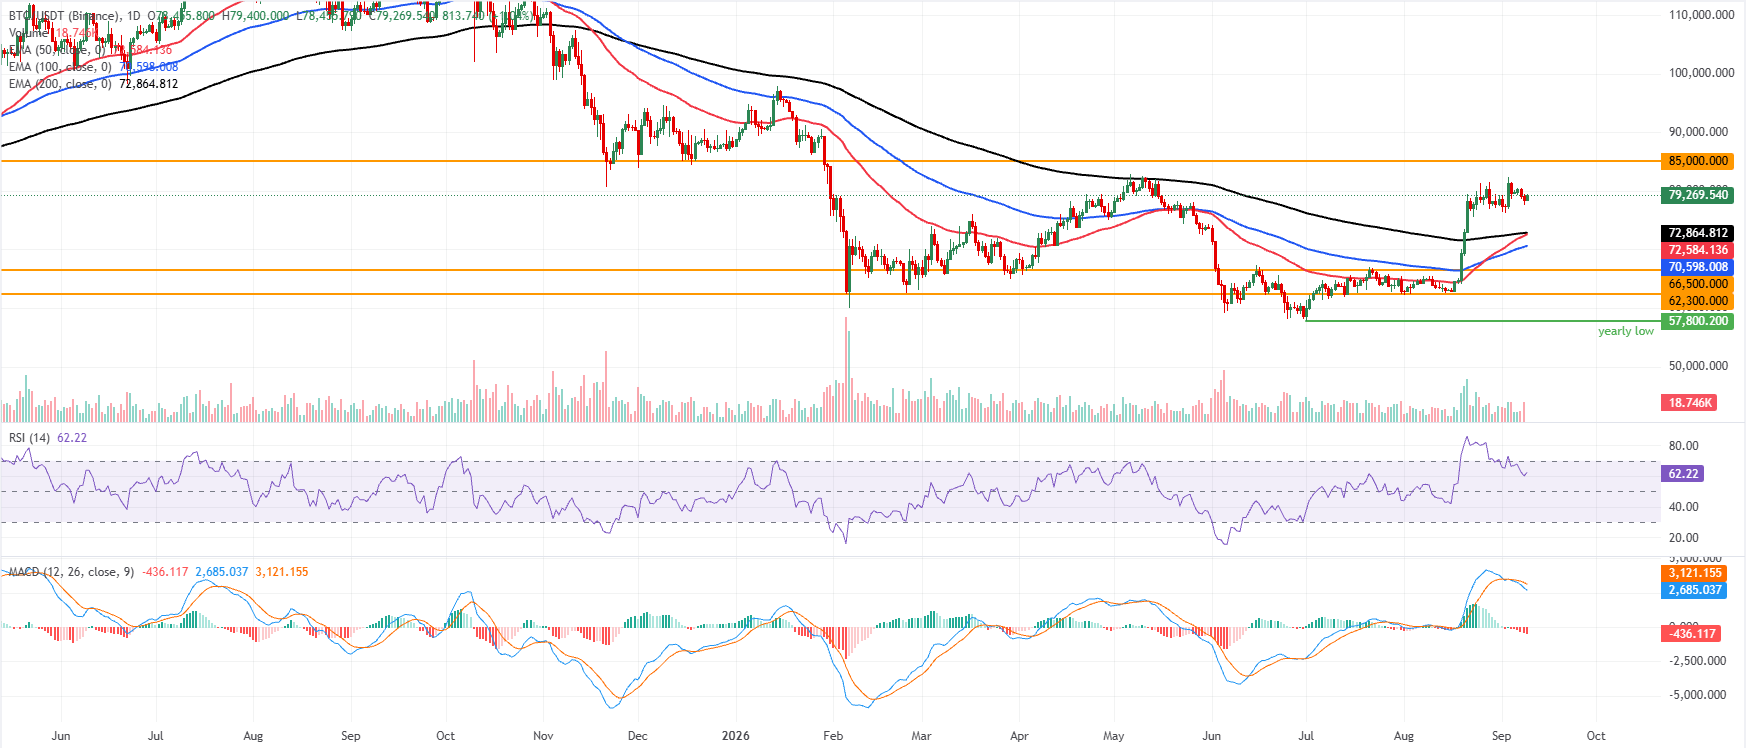
Bitcoin price recovers slightly, trading at $79,269 at the time of writing on Wednesday after a mild pullback in the previous two days. BTC holds a bullish near-term bias as it stays well above the 50-day, 100-day, and 200-day Exponential Moving Averages (EMAs), clustered between roughly $70,600 and $72,900.
This constructive positioning is tempered by waning momentum, with the Relative Strength Index (RSI) easing to about 62 from earlier overbought extremes and the Moving Average Convergence Divergence (MACD) slipping deeper into negative territory, suggesting upside momentum is fading even as the broader uptrend remains intact.
On the downside, initial support is expected around the 50-day EMA near $72,584, reinforced by the 200-day EMA close to $72,864 and the 100-day EMA around $70,598, before stronger demand is anticipated at the horizontal levels of $66,500 and $62,300.
On the topside, the next notable resistance stands at the horizontal barrier near $85,000, and a clear daily close above this cap would be needed to revive a more impulsive bullish leg.
(The technical analysis of this story was written with the help of an AI tool. Know more.)
Bitcoin, altcoins, stablecoins FAQs
Bitcoin is the largest cryptocurrency by market capitalization, a virtual currency designed to serve as money. This form of payment cannot be controlled by any one person, group, or entity, which eliminates the need for third-party participation during financial transactions.
Altcoins are any cryptocurrency apart from Bitcoin, but some also regard Ethereum as a non-altcoin because it is from these two cryptocurrencies that forking happens. If this is true, then Litecoin is the first altcoin, forked from the Bitcoin protocol and, therefore, an “improved” version of it.
Stablecoins are cryptocurrencies designed to have a stable price, with their value backed by a reserve of the asset it represents. To achieve this, the value of any one stablecoin is pegged to a commodity or financial instrument, such as the US Dollar (USD), with its supply regulated by an algorithm or demand. The main goal of stablecoins is to provide an on/off-ramp for investors willing to trade and invest in cryptocurrencies. Stablecoins also allow investors to store value since cryptocurrencies, in general, are subject to volatility.
Bitcoin dominance is the ratio of Bitcoin's market capitalization to the total market capitalization of all cryptocurrencies combined. It provides a clear picture of Bitcoin’s interest among investors. A high BTC dominance typically happens before and during a bull run, in which investors resort to investing in relatively stable and high market capitalization cryptocurrency like Bitcoin. A drop in BTC dominance usually means that investors are moving their capital and/or profits to altcoins in a quest for higher returns, which usually triggers an explosion of altcoin rallies.
Recommended Articles


